
The latest dwelling construction data from the Australian Bureau of Statistics (ABS), released on Wednesday, revealed that only 180,546 homes were completed in the June 2026 year, 59,454 (25%) fewer than the National Housing Accord’s annual target of 240,000 dwellings a year.
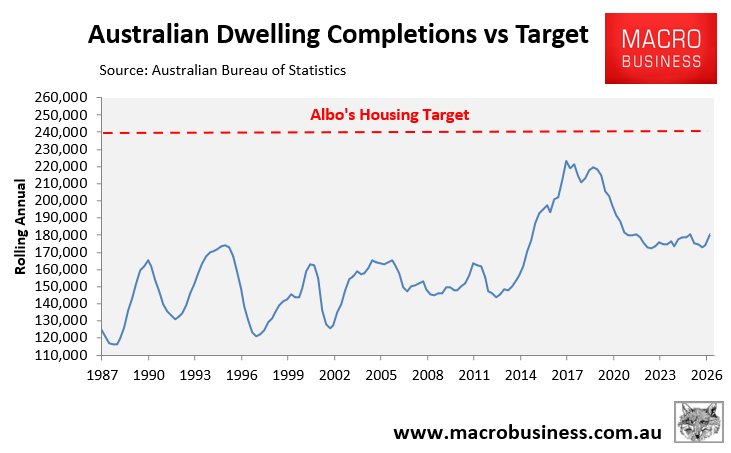
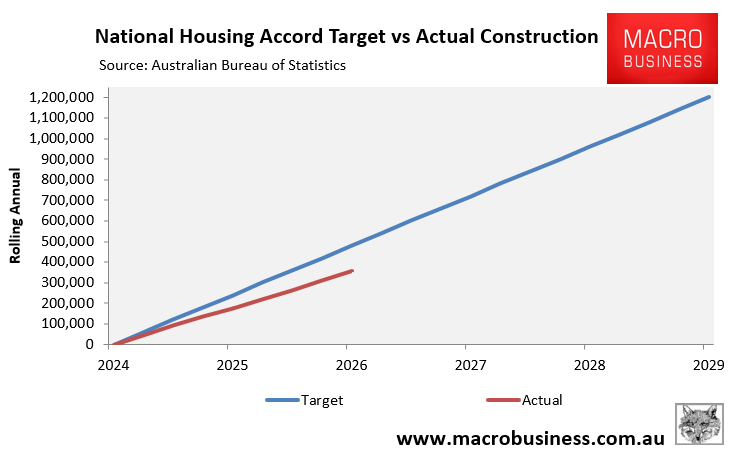
Over the first 24 months of the National Housing Accord, 124,183 fewer homes have been constructed than the target, representing a shortfall of 26%.
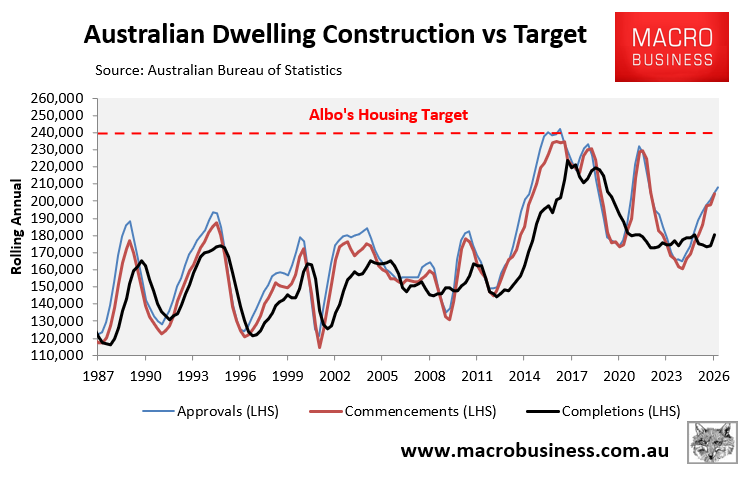
The following chart shows that dwelling approvals and commencements are tracking far above actual completions, suggesting Australia’s construction pipeline is severely bottlenecked by labour shortages, soaring costs, builder insolvencies, and timeline blowouts.
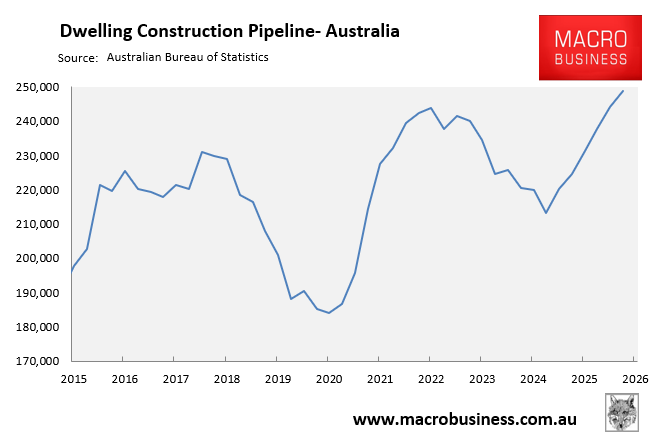
As a result, there were a record 248,733 dwellings under construction in the June quarter of 2026:
However, as Justin Fabo from Antipodean Macro shows below, if you add homes approved but not yet commenced, the pipeline swells by a further 30,200:
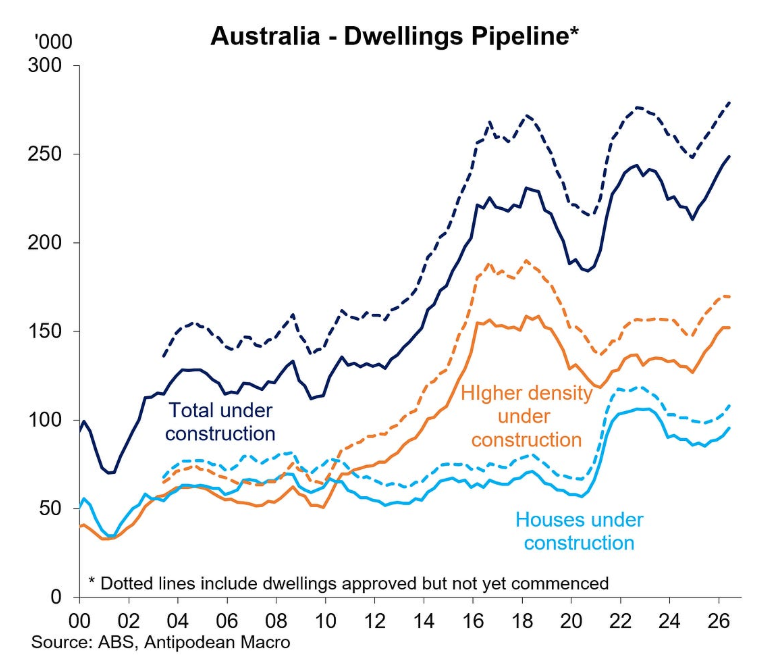
Chart by Justin Fabo (Antipodean Macro)
Part of the reason why the dwelling construction pipeline has bulged is that the time taken to build apartments has blown out to more than nine quarters:
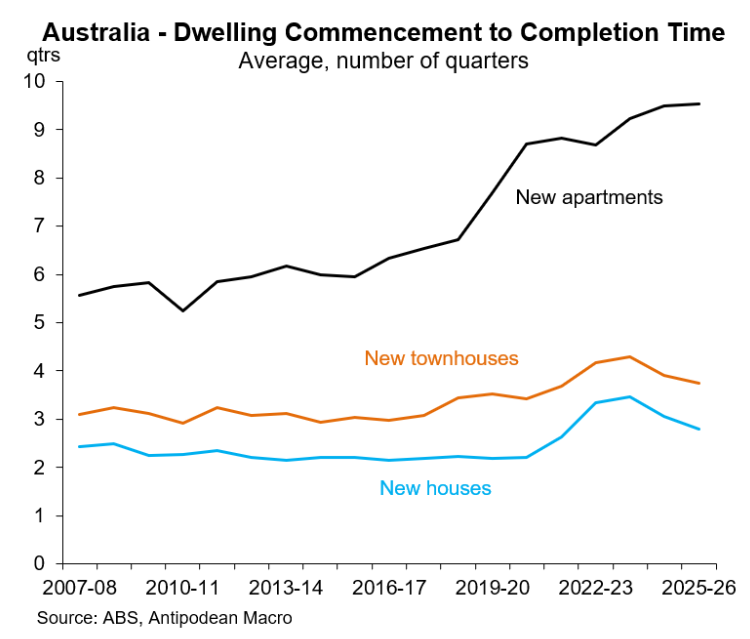
Chart by Justin Fabo (Antipodean Macro)
As noted by Michael Matusik in last week’s “Monday Build” newsletter:
“Australia does not have an approvals shortage alone. It has a conversion problem”…
“The Productivity Commission estimates Australia produces roughly half as many homes per construction hour as it did in 1995. Since the mid-1990s—so over the past 30 years—quality-adjusted construction productivity has fallen 12%, while economy-wide productivity increased 49%”.
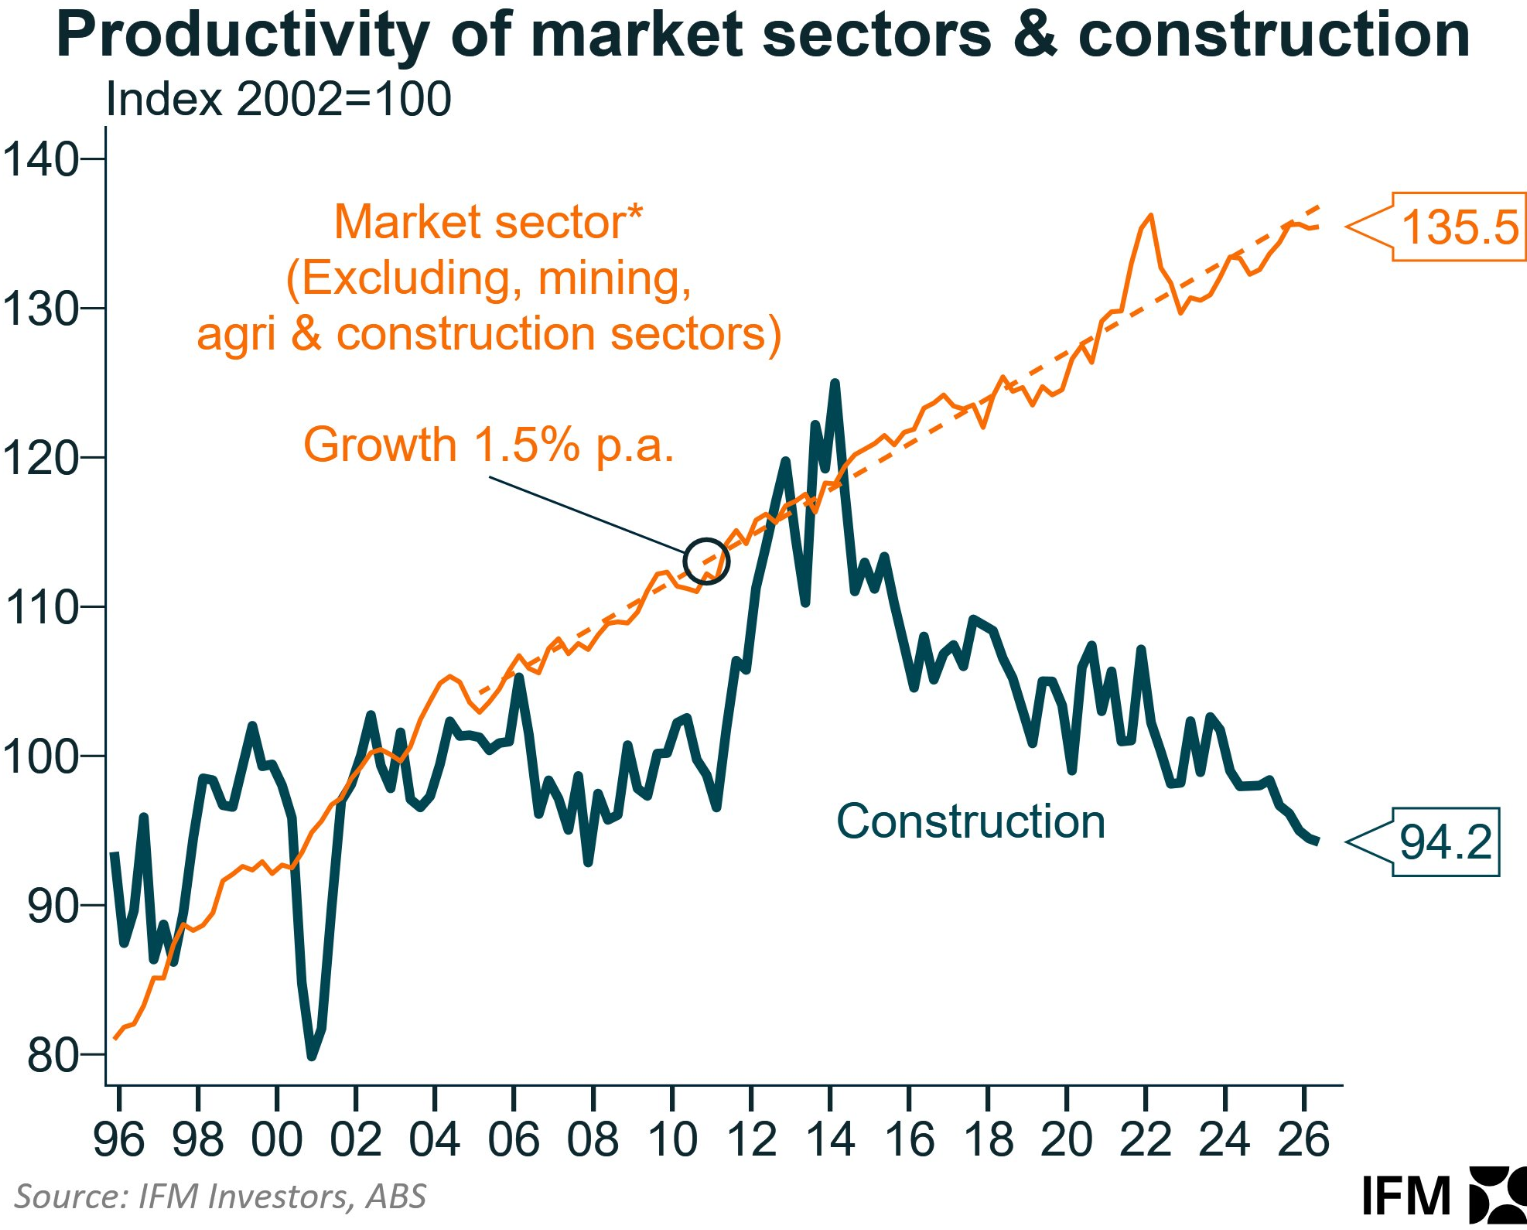
Chart by Alex Joiner (IFM Investors)
The outlook for dwelling construction has worsened recently.
First, after rising by more than 40% since the pandemic, dwelling cost inflation remains strong, up 5.4% in the 12 months to August 2026.
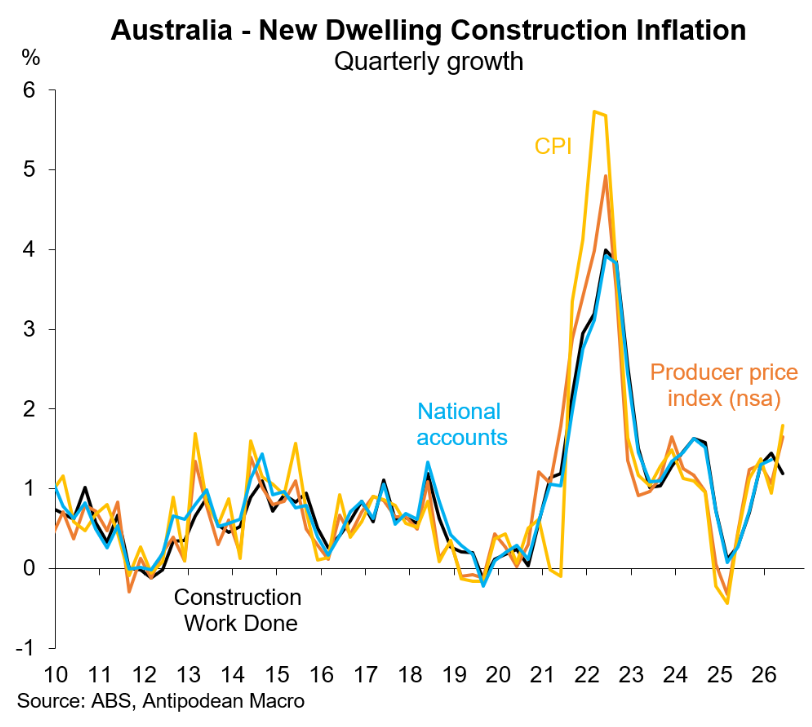
Chart by Justin Fabo (Antipodean Macro)
Dwelling approvals and, ergo, construction also tend to decline when values are falling:
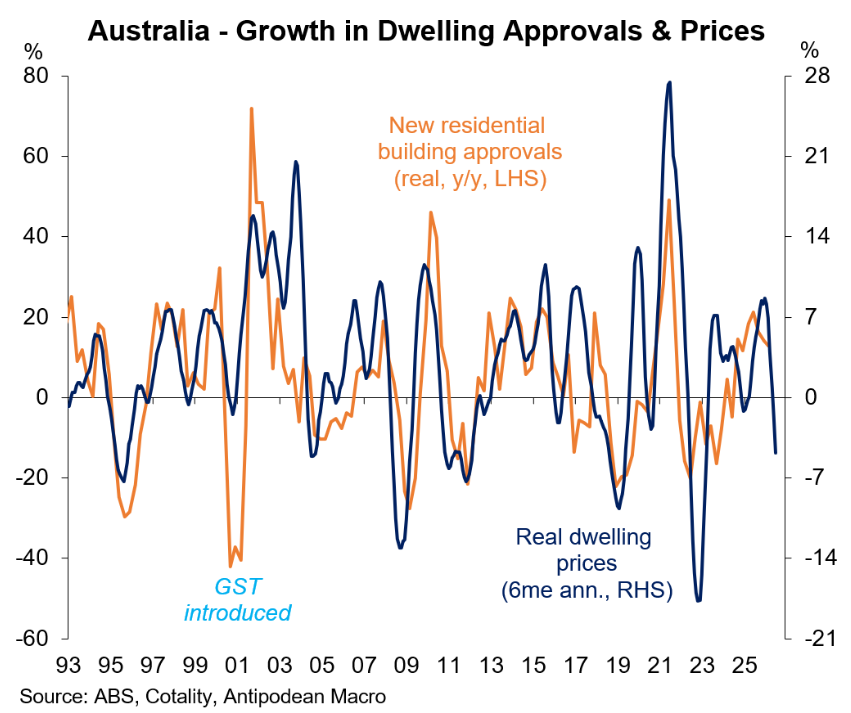
Chart by Justin Fabo (Antipodean Macro)
Given that interest rates are still rising and housing values are facing their steepest declines in more than 40 years, already down by 6.8% across the five major capital cities, construction will inevitably decline.
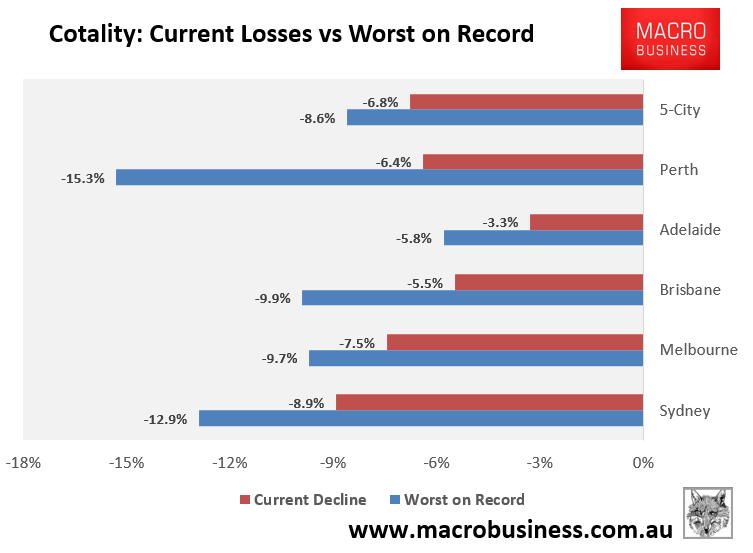
Detached house sales have also declined sharply, portending further falls in house approvals:
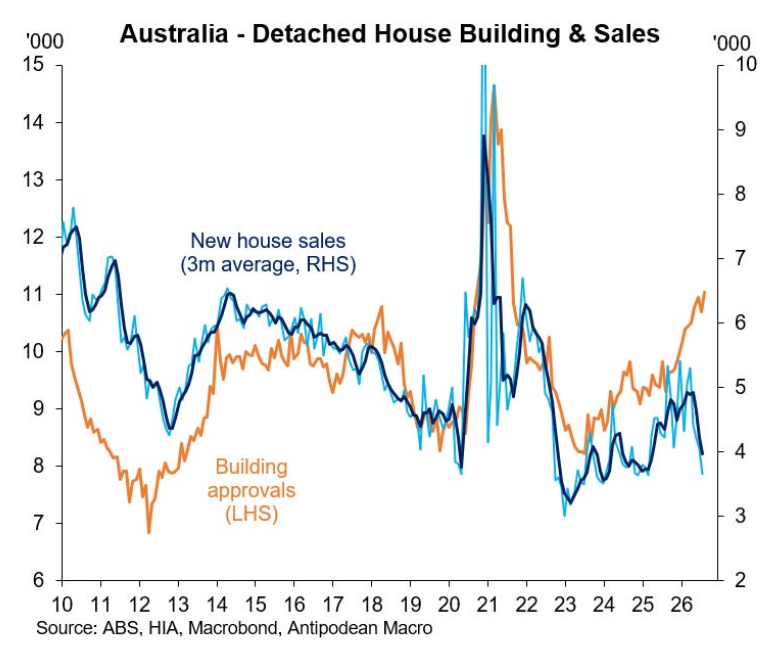
Chart by Justin Fabo (Antipodean Macro)
Finally, the meltdown in the private credit market following the collapse of Baltha Group — one of Western Sydney’s biggest home builders — has directly threatened 2,000 homes currently under construction and 15,000 future dwellings.
The private credit sector has grown extremely fast and is a major lender to property developers, with an estimated $100 billion of loans outstanding to the sector.
As a result, Baltha Group’s collapse hints at deeper credit stress and risks seizing lending to property developers, further hampering construction.
The upshot is that Australian dwelling construction will very likely follow prices lower, deepening the nation’s housing shortage amid excessive immigration flows.
