
Australia’s house price correction of -5.7% since mid-April 2026 has now gotten within 3% of the largest downturn in recorded history (40 years), which was -8.6% between October 2017 and May 2019.
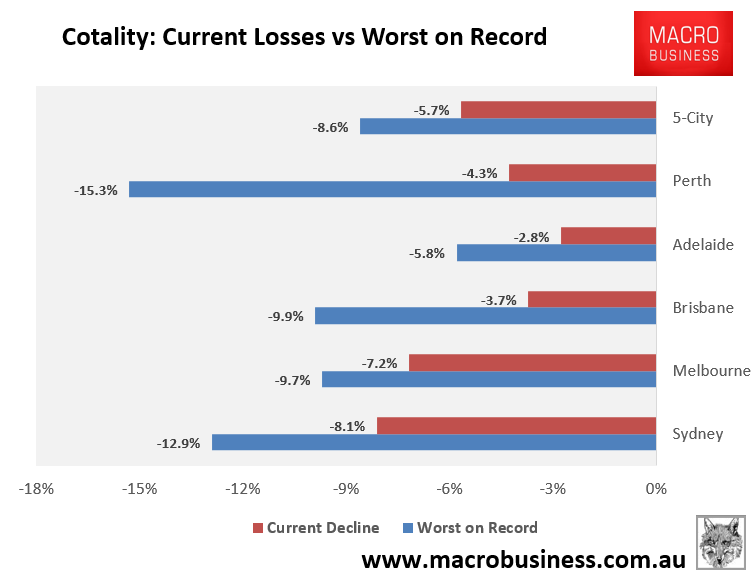
The correction has also spread to the mid-sized capitals of Brisbane, Adelaide, and Perth, which are declining slightly faster than the two largest capitals, Sydney and Melbourne.
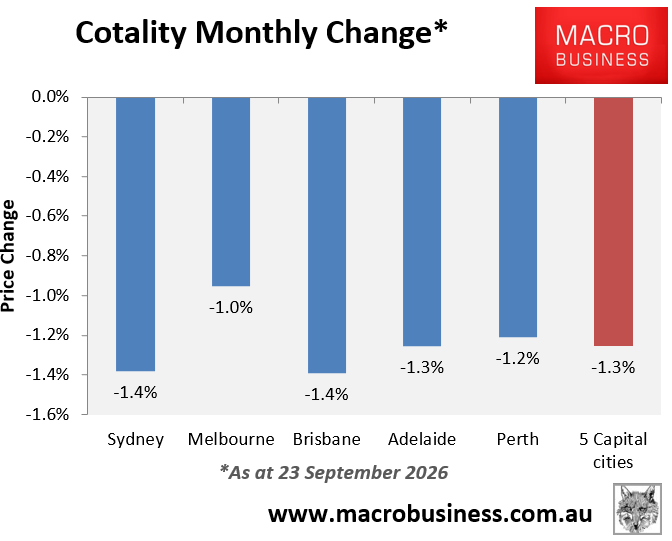
At the current rate of decline, Australia’s housing market will record its biggest price decline on record before the end of 2026, and it will have done so in less than half the time taken during the October 2017 and May 2019 corrections.
HSBC currently has the most realistic bank forecast for the current housing correction, tipping a 13% peak-to-trough decline across the capital cities over 15 months:
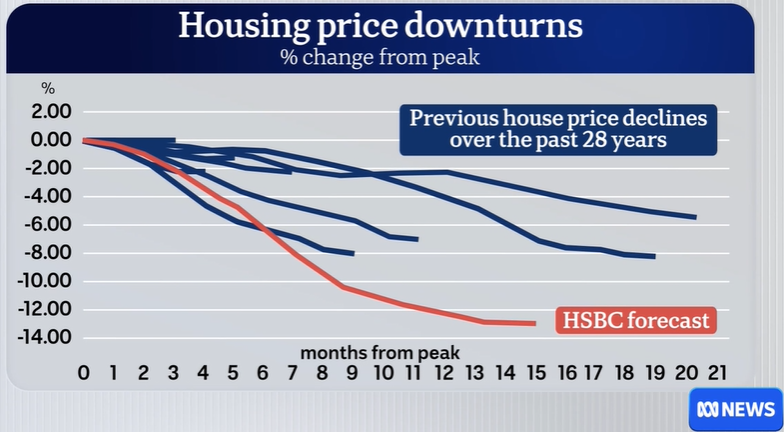
Chart from Alan Kohler (ABC)
Even this forecast may prove optimistic, given the financial market’s forecast of at least two and maybe three more rate hikes from the Reserve Bank:
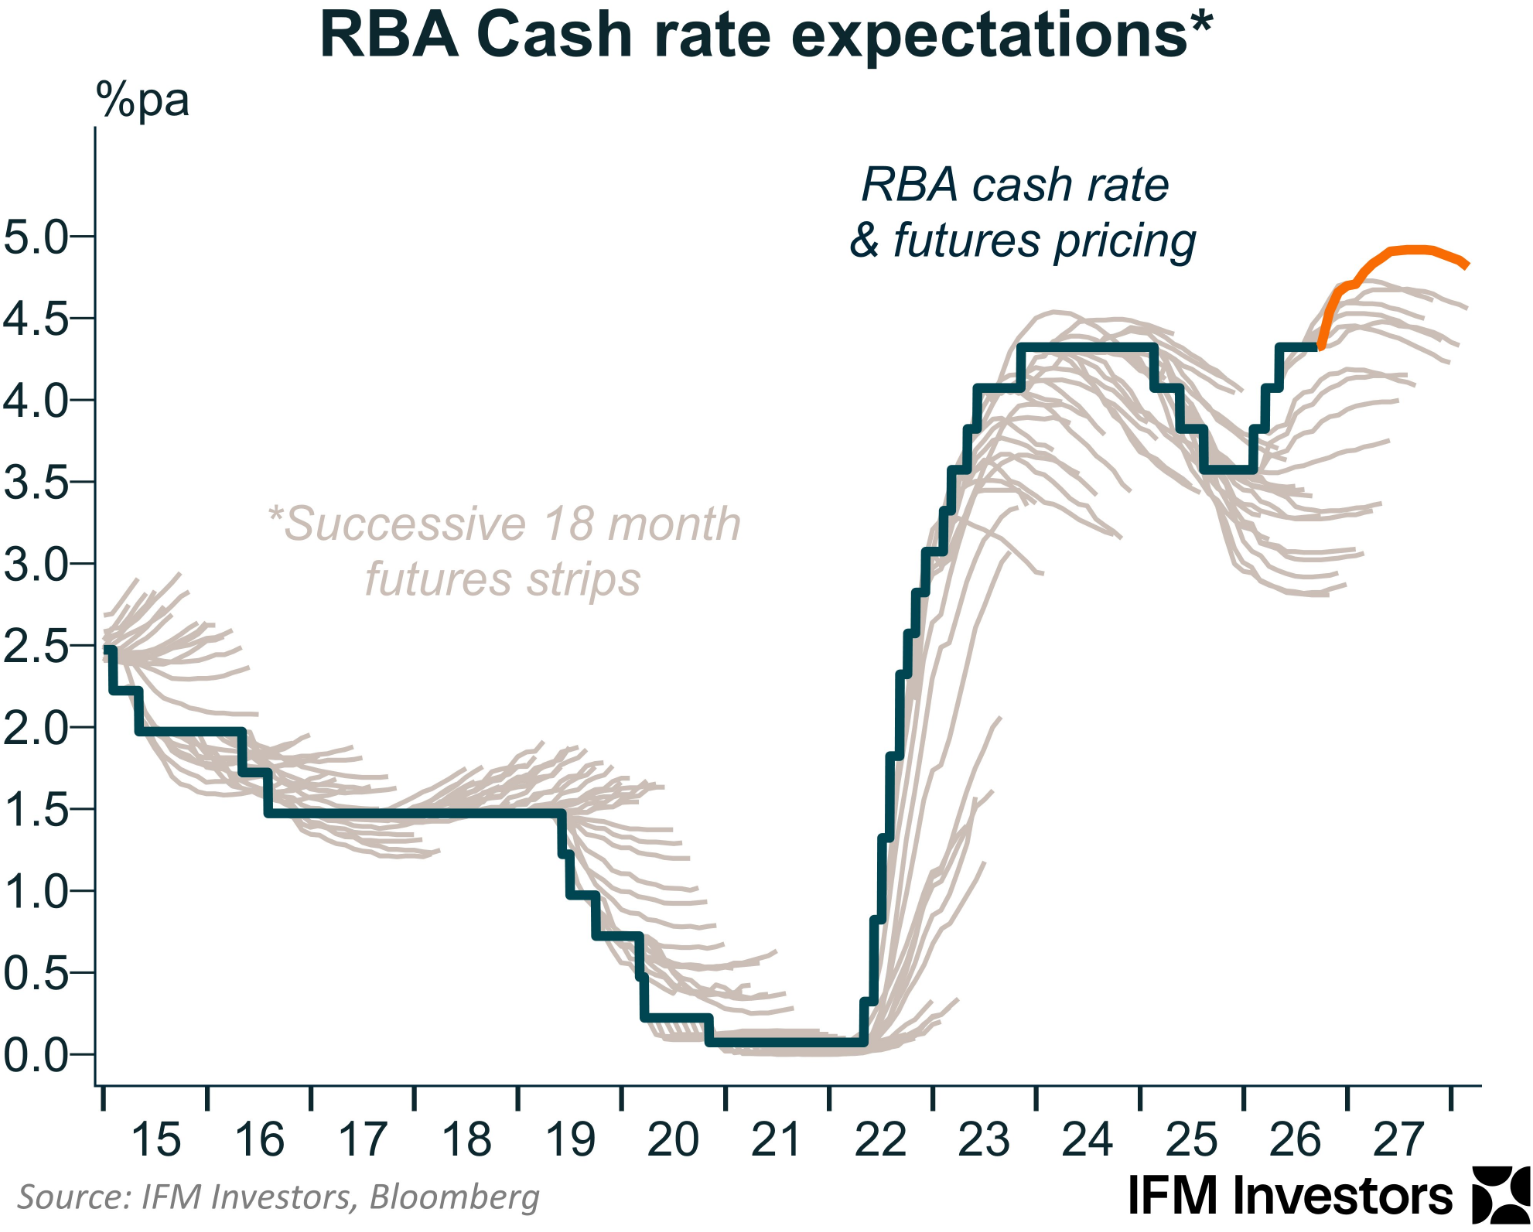
Chart from Alex Joiner (IFM Investors)
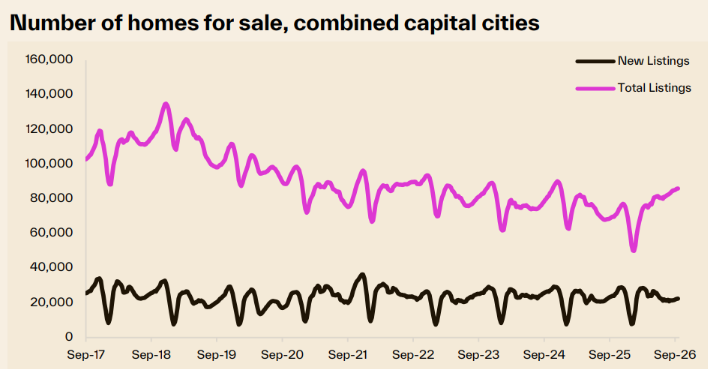
The latest for-sale listings data from Cotality suggests that the downturn will increasingly be driven by the mid-sized capital cities.
While overall capital city listings are tracking 23.1% higher than 12 months ago:
Source: Cotality
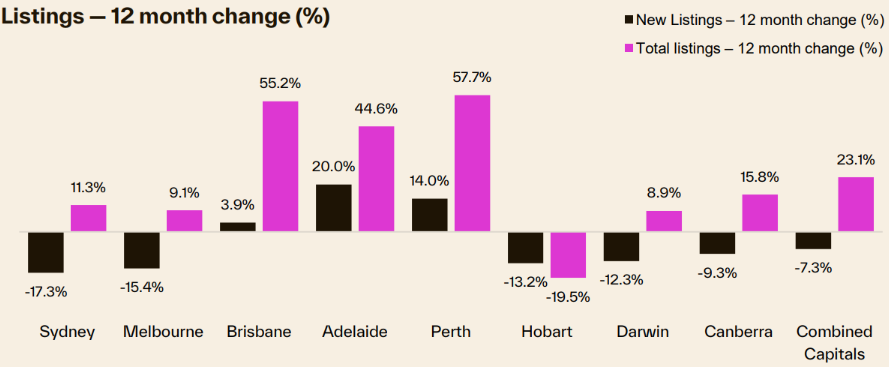
The increase in listings has been greatest for the mid-sized capitals, namely Brisbane (+55.2%), Perth (+57.7%), and Adelaide (+44.6%):
Source: Cotality
Meanwhile, Ray White data on attendances at open homes suggests that buyer demand has evaporated:
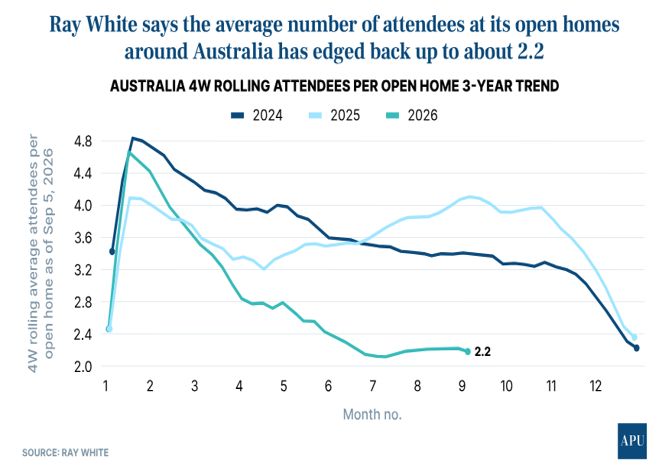
Chart from APU
Brisbane, in particular, looks particularly vulnerable given that auction clearance rates there have collapsed into the low-30s:
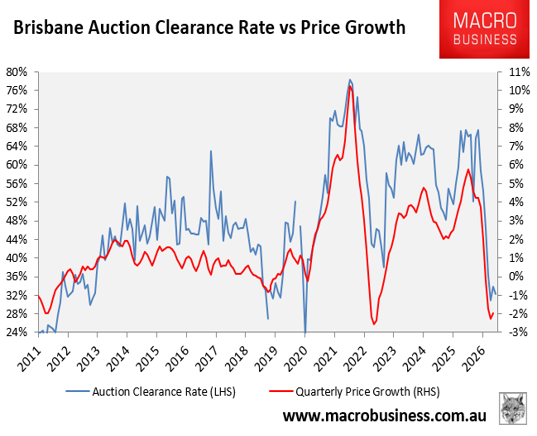
Soaring listings into falling demand spells one thing: falling prices.
The perfect storm of extreme unaffordability, rising interest rates, and the federal budget’s changes to negative gearing and capital gains tax will inevitably deliver the largest house price correction seen in living memory.
