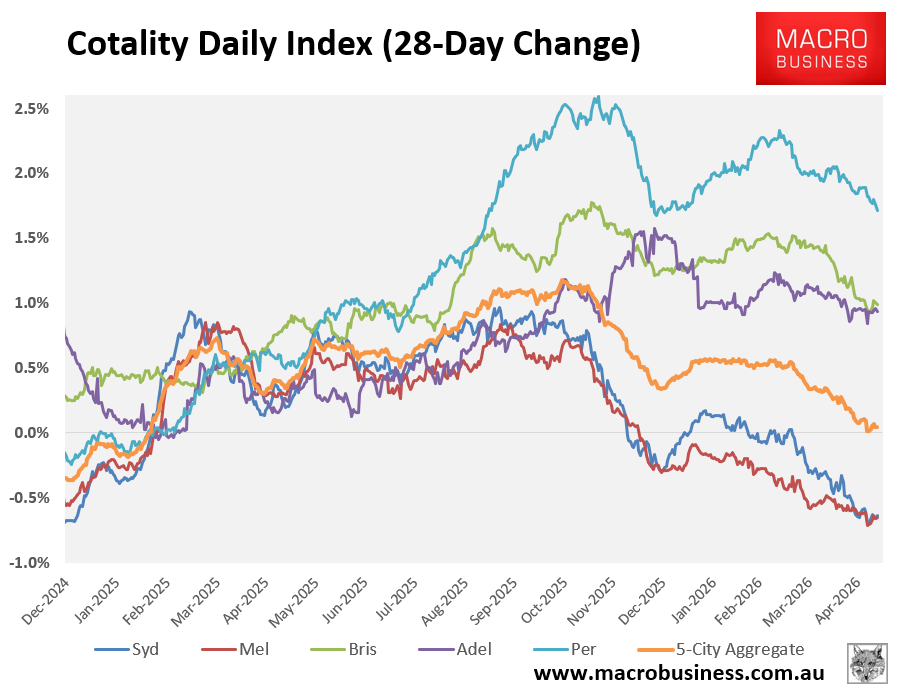
The latest data from Cotality shows that home prices across the major capital city markets continue to lose steam.
As illustrated below, value growth has slowed across all five major capital city markets, with Sydney and Melbourne recording significant outright declines:
Cotality’s weekly indicators report provided a strong clue to why value growth has stalled: there has been a sharp increase in for-sale listings compared to 12 months ago:
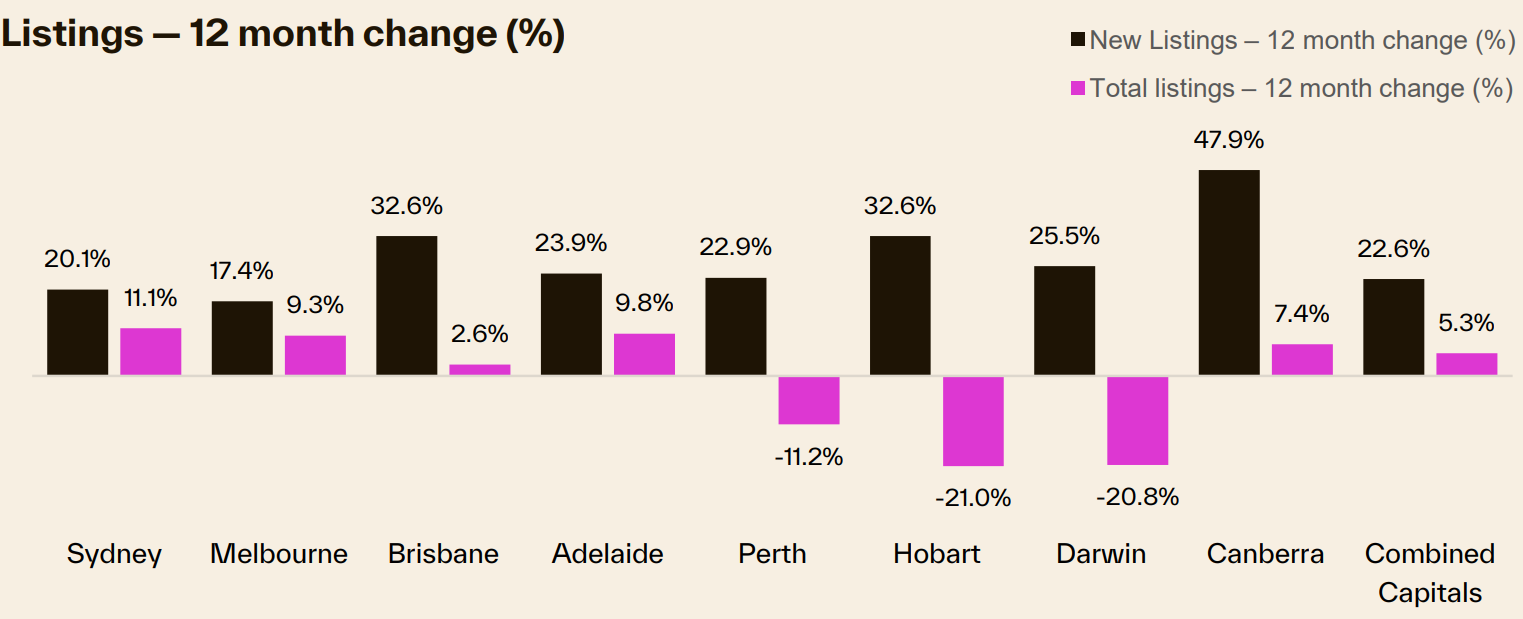
Source: Cotality
All capital city markets have experienced a strong rise in new listings relative to the same time last year, whereas Sydney, Melbourne, Brisbane, Adelaide and Canberra have also experienced increases in total listings versus a year ago.
Total listings in Perth, Hobart and Darwin remain significantly below the same time last year, despite the strong rise in new listings.
At the same time as listings are rising across the combined capitals, Cotality’s latest monthly chart pack shows that sales volumes have fallen below the five-year average over the past six months:
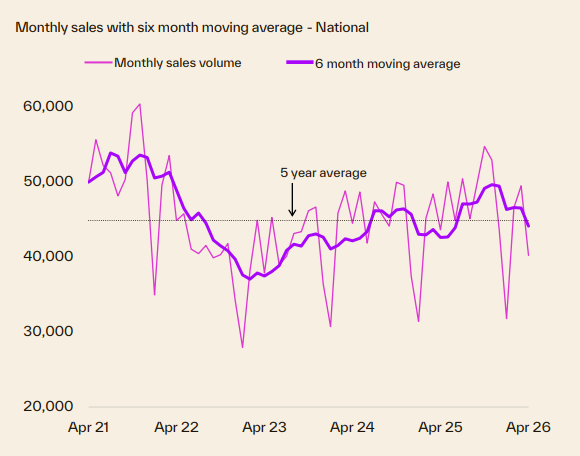
Source: Cotality
This decline in buyer demand matches the sharp decline in auction clearance rates reported by Cotality.
The most significant price decline recorded by Cotality over the past 40 years was in 2017-19, when values fell by 8.2% amid credit tightening following a period of solid growth. Values also fell by 8.1% over 9 months in 2022-23 as interest rates rose from emergency lows post-pandemic:
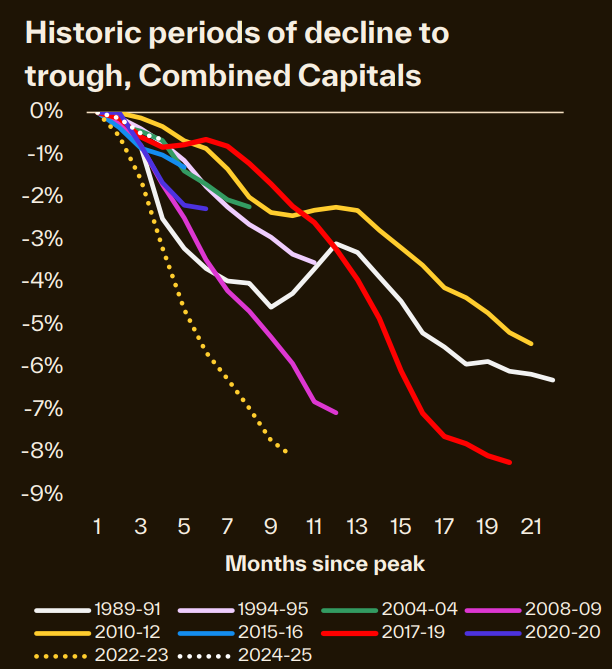
Source: Cotality
Given the Australian housing market’s record overvaluation relative to incomes, pending changes to negative gearing and the capital gains tax discount, the forecast of at least one more interest rate rise this year, and the RBA’s forecast of higher unemployment, home values look poised for their largest decline in at least 40 years.
In the end, the equation facing home prices is summarised in the following chart from Shane Oliver at AMP:
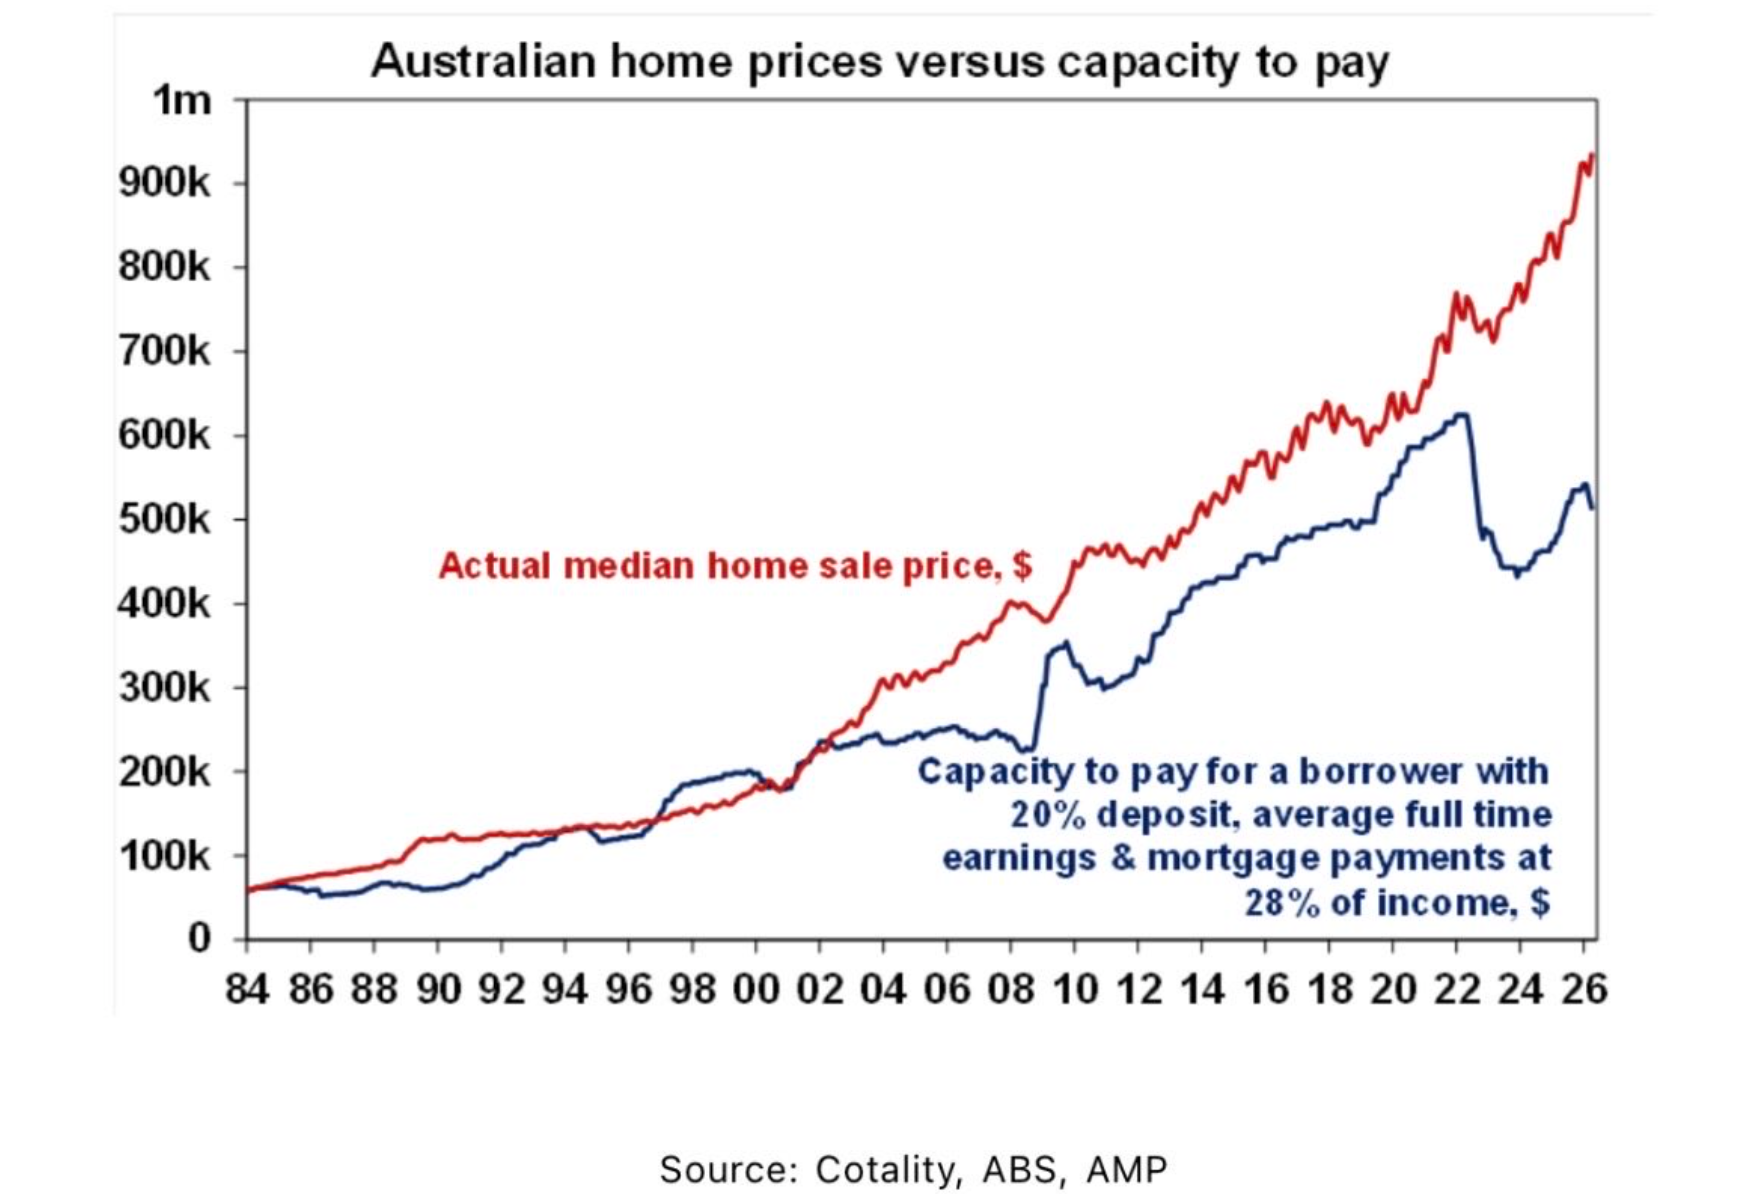
Australian home values have risen beyond what buyers can afford at the prevailing interest rates. Therefore, as interest rates rise further, home values nationally will fall.
The jaws must close, with the red line (home prices) falling towards the blue line (capacity to pay).
