Last month, the Australian Bureau of Statistics (ABS) released the annual national accounts for 2023-24, which included extensive land value data.
Land values underpinning the Australian housing market increased by 8.8% during 2023-24.
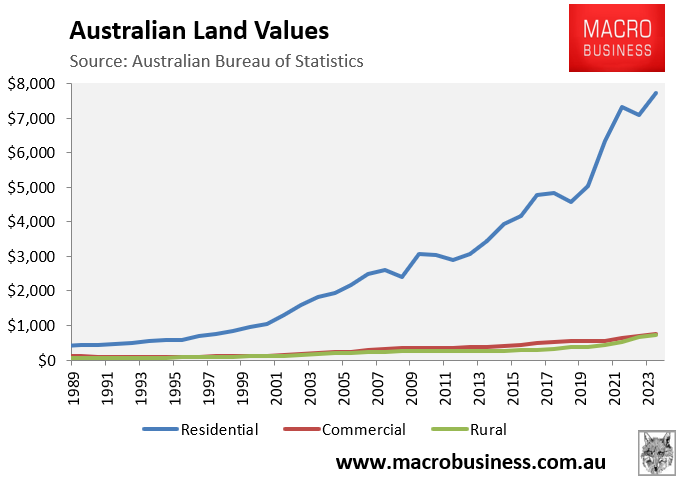
In 2023-24, Australia’s land was valued at $9.2 trillion, with residential land accounting for 84% ($7.7 trillion).
The chart below displays Australia’s aggregate land values by use as a ratio of GDP since 1989, the earliest data available:
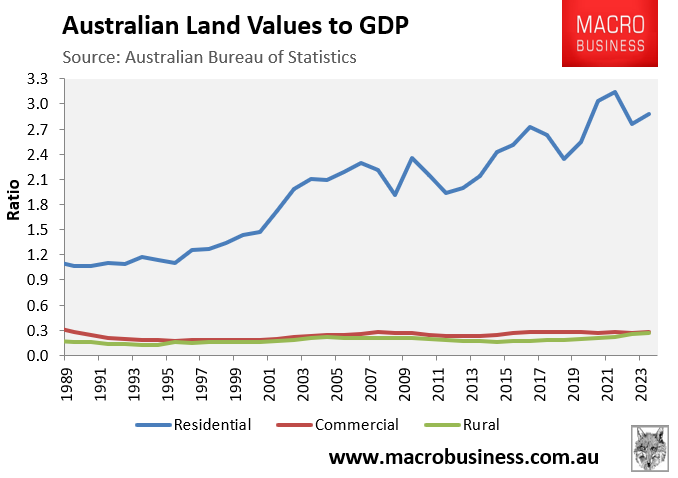
While aggregate Australian business and rural land values have remained relatively stable in relation to GDP over the last 35 years, residential land values have skyrocketed, rising from 1.1 to 2.9 times GDP by 2023-24.
When the aggregate residential land values data is combined with the Reserve Bank of Australia’s (RBA) dwelling values data, which includes both residential land values and structures (buildings), it is clear that rising land costs have driven the increase in Australia’s housing values over the last 25 years.
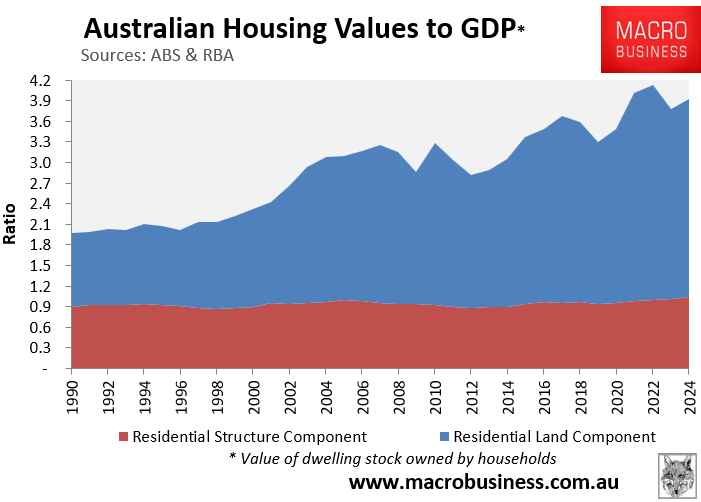
Aggregate structure values, which are calculated by subtracting the ABS’ residential land value estimates from the RBA’s dwelling asset figures, were 0.88 times GDP in 1988-89 and have climbed to 1.04 times GDP as of 2023-24.
In contrast, the total value of Australia’s housing stock (land and structures) grew from 2.0 times GDP in 1988-89 to 3.9 times GDP in 2023-24, owing to strong inflation in land values.
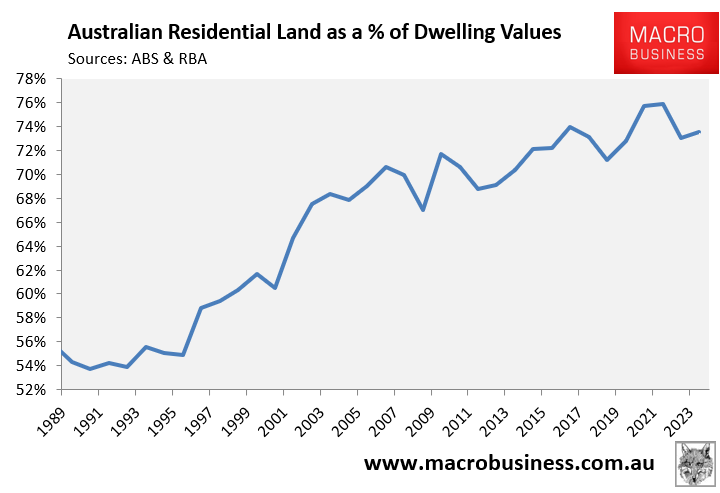
Reflecting the fact that residential land has increased in value compared to structures, the land component of Australia’s housing stock has increased from 54% in 1990-91 to 74% of GDP in 2023-24.
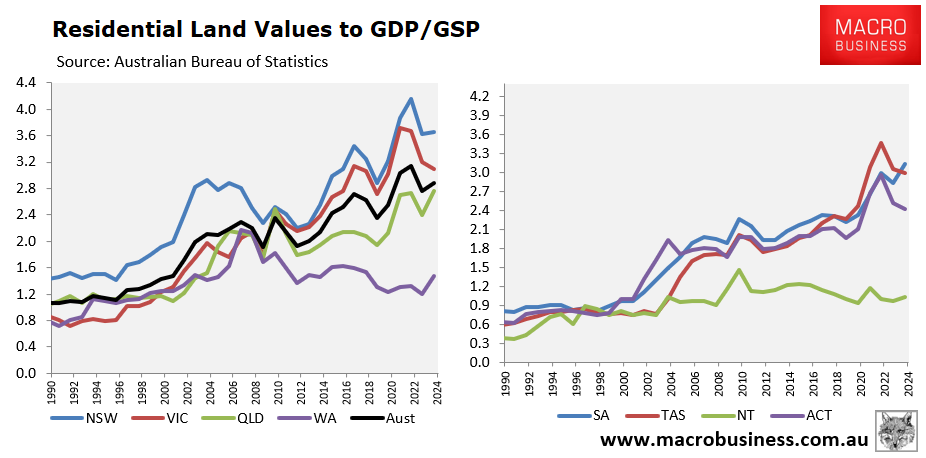
On Wednesday, the ABS released the annual state accounts for 2023-24, which enables similar calculations at the state level.
Looking at the time series, land values as a ratio of GDP were highest in NSW (3.65), followed by SA (3.14), VIC (3.09), TAS (3.00), QLD (2.76), ACT (2.42), WA (1.48) and NT (1.03).
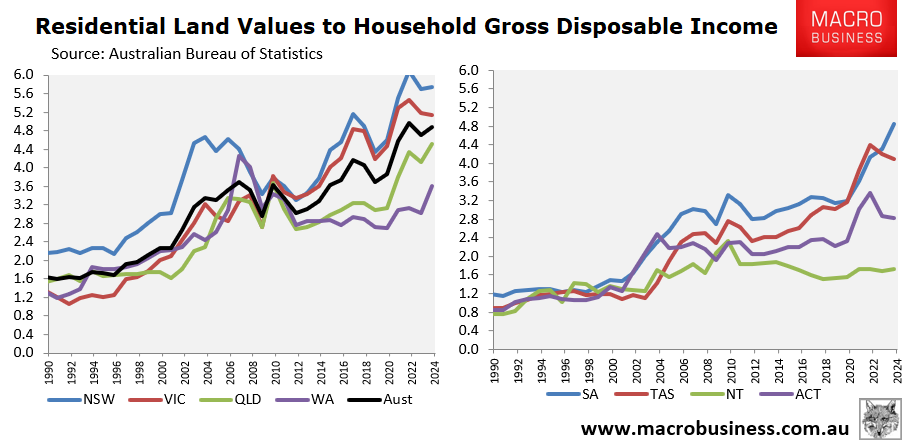
It is a similar story when land values are compared against household incomes.
NSW leads the way (5.74), followed by VIC (5.14), SA (4.85), TAS (4.10), QLD (4.52), WA (3.60), ACT (2.83) and NT (1.73).
As part of its quarterly house price release, the ABS includes a time series measuring the value of the housing stock broken-down by state and territory.
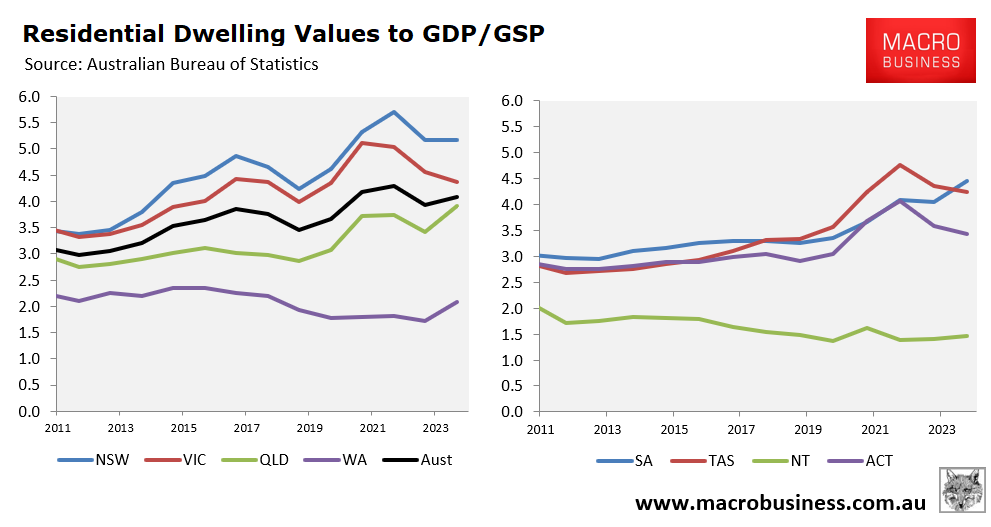
The following chart compares these values as at 30 June 2024 against their respective GSPs/GDP:
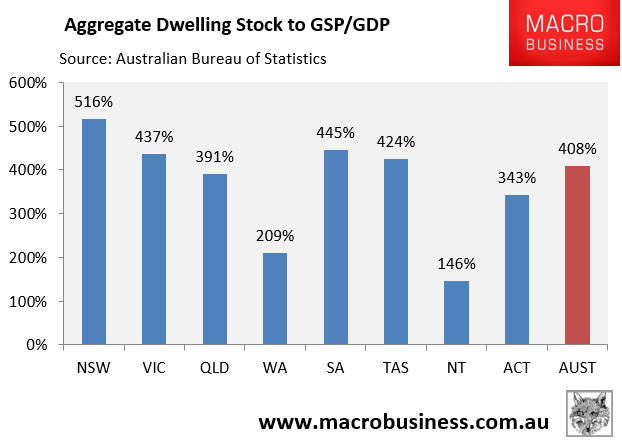
Once again, NSW leads the way (516%), followed by SA (445%), VIC (437%), and TAS (424%).
The same data is presented as a time series, dating back to the beginning in 2010-11:
The same ABS housing stock data is presented below against household disposable income across each major jurisdiction and nationally:
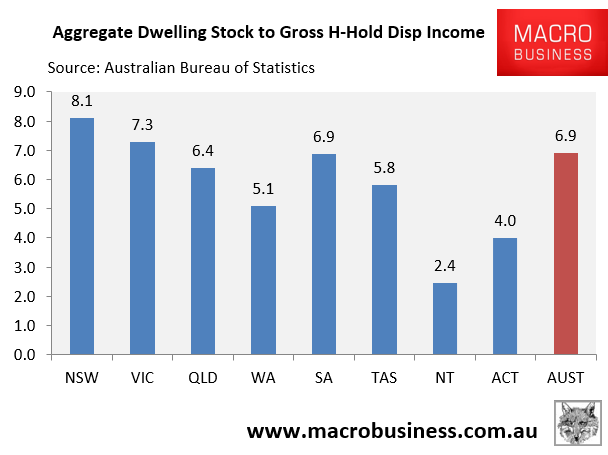
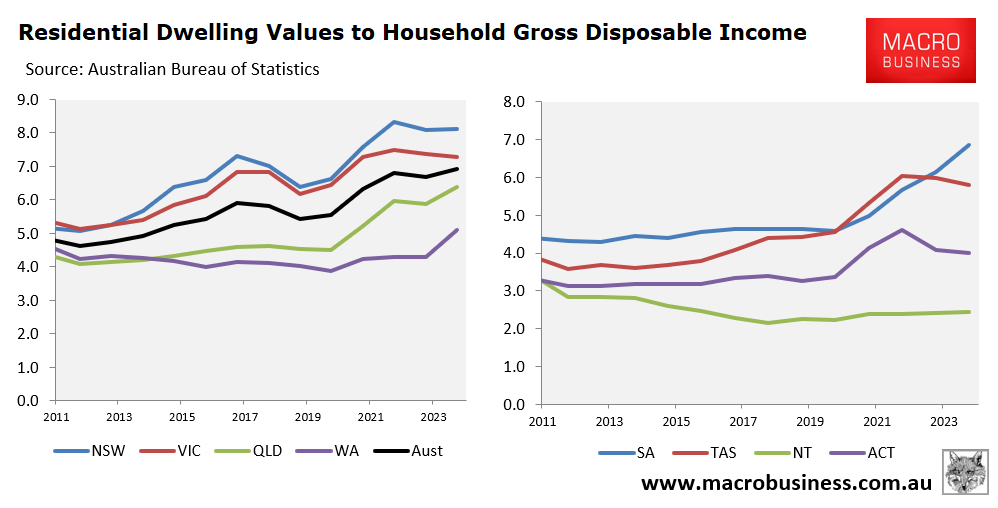
Not surprisingly, NSW (8.1) has the most expensive housing, followed by VIC (7.3), SA (6.9), and QLD (6.4).
Again, the data is presented as a time series dating back to the beginning of the series in 2010-11:
The rise in land costs is also evident in the new home market.
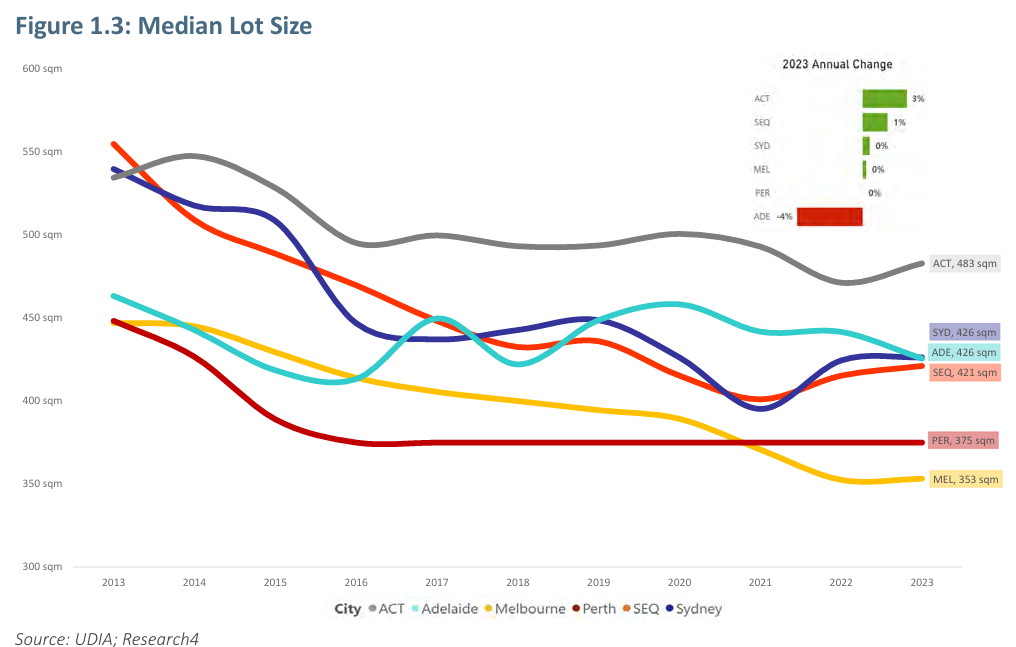
According to the Urban Development Institute of Australia, land costs have risen significantly in all major capitals during the last decade.
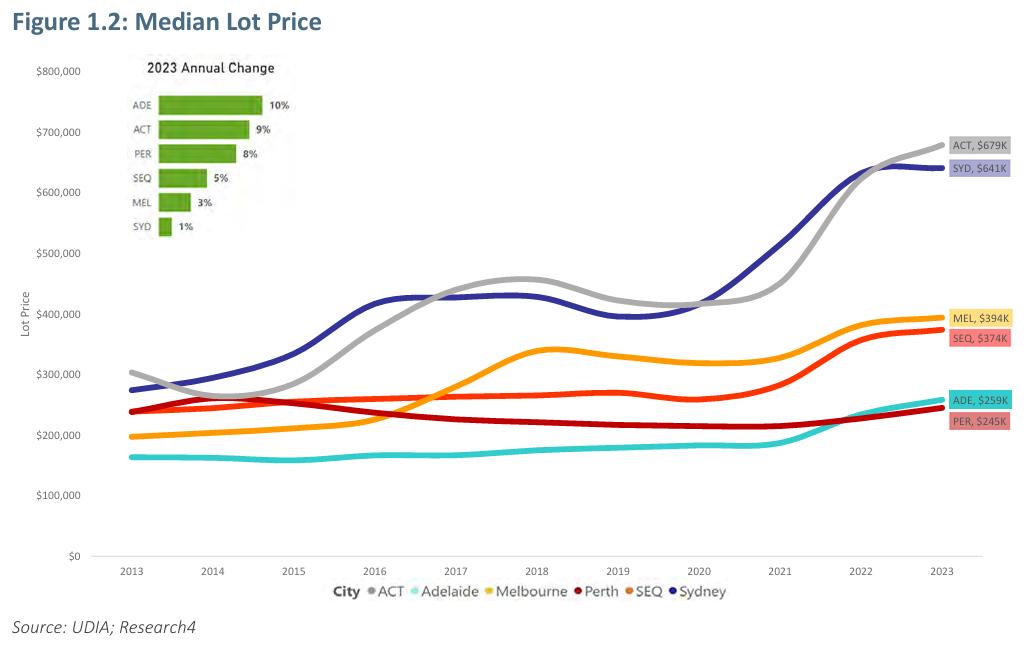
Despite the fact that lot sizes are reducing, median lot prices have increased.
The rising cost of land in Australia is one of the major impediments to developing new dwellings for the rapidly expanding population.
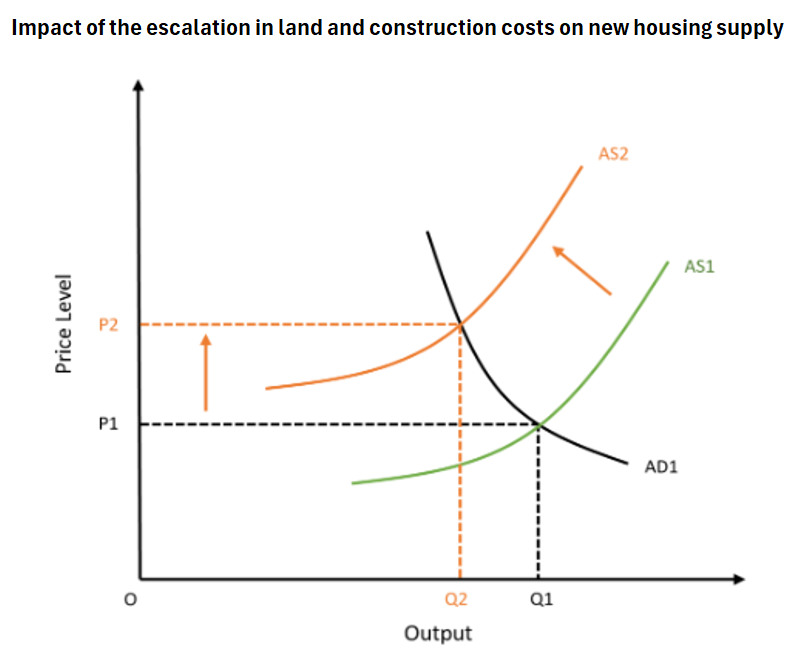
In economic terms, this land cost-push inflation has shifted the aggregate supply curve to the left, reducing the capacity for building homes at every price tier:
