HSBC chief economist Paul Bloxham has warned that Australia’s productivity decline since the pandemic has been the steepest in the world and that the nation risks stagflation and higher interest rates if the situation is not reversed:
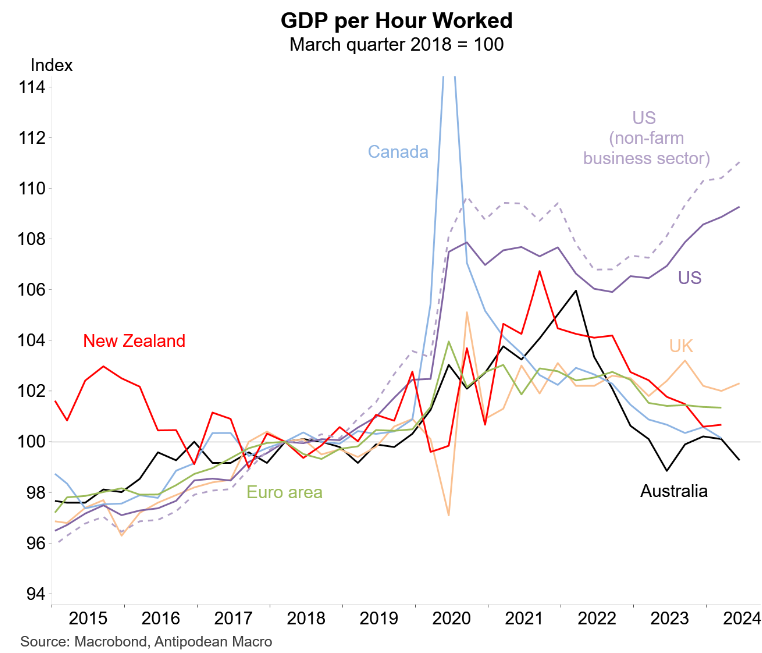
Unfortunately, Australia has had the worst productivity performance of any comparable developed economy in the post-pandemic period. The second quarter GDP figures, released recently, suggest that GDP per hour worked, a key measure of labour productivity, is no higher than it was in 2016.
The list of policy measures that could be taken to improve productivity is long. A short one would include making the labour market more flexible through industrial relations reforms, removing unnecessary regulation, reforming the tax system, and a broad-based focus on improving competition.
According to the Q2 national accounts released this month by the Australian Bureau of Statistics (ABS), the nation’s labour productivity is tracking at the same level as September 2016. In other words, labour productivity has experienced zero growth over nearly eight years.
The next chart from Justin Fabo at Antipodean Macro also shows that Australia has experienced the worst labour productivity growth among the Anglosphere since 2018:
Diagnosing productivity is always difficult. However, I believe there are two primary reasons why Australia’s labour productivity has been so poor.
First, Australia’s population has grown more quickly than business and infrastructure investment over recent decades. This has resulted in “capital shallowing” and resulted in Australia having less capital per worker and higher congestion costs, lowering the nation’s productivity growth.
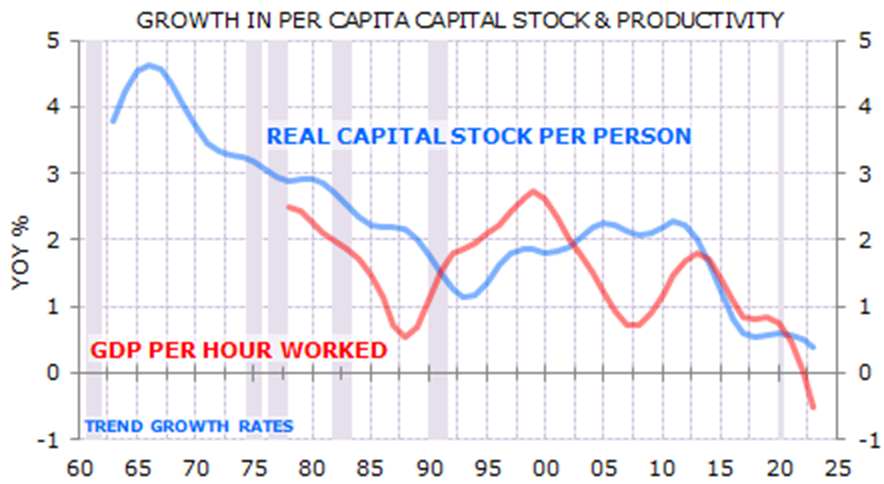
Source: Gerard Minack
Leading independent economist Gerard Minack explained Australia’s capital shallowing as follows:
Australia’s economic performance in the decade before the pandemic was, on many measures, the worst in 60 years. Per capita GDP growth was low, productivity growth tepid, real wages were stagnant, and housing increasingly unaffordable…
There were many reasons for the mess, but the most important was a giant capital-to-labour switch: Australia relied on increasing labour supply, rather than increasing investment, to drive growth…
The capital-to-labour switch has been massively detrimental to living standards. To maintain living standards a country’s capital stock – assets such as schools, roads, hospitals, factories, offices, and housing – needs to match its population growth. Without that investment living standards fall…
The high population growth of the past 15 years has meant that almost all Australia’s investment spending has been the equivalent of replacing smashed windows…
Capital deepening drives productivity. The switch to a population-led growth model has starved Australia of capital deepening investment. The result is declining productivity…
Second, Australia’s economy has become increasingly reliant on government-aligned sectors for growth and employment:
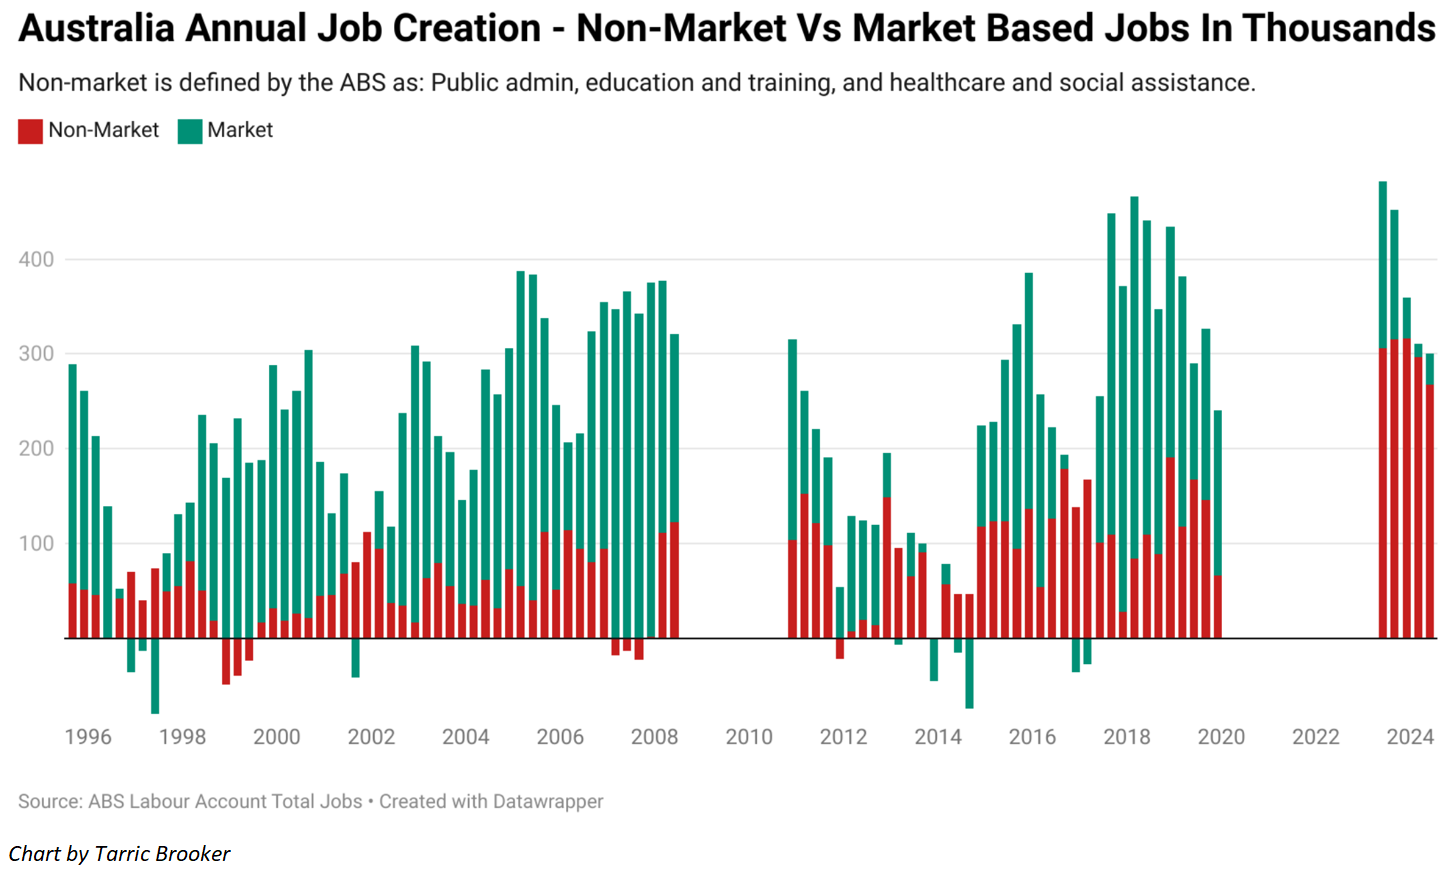
In the 2023-24 financial year, 268,000 government-funded industry jobs were created versus 33,000 new market based jobs (i.e., every other industry).
Productivity in the government-funded sectors, such as health and education, fell to 2006 levels during the June quarter:
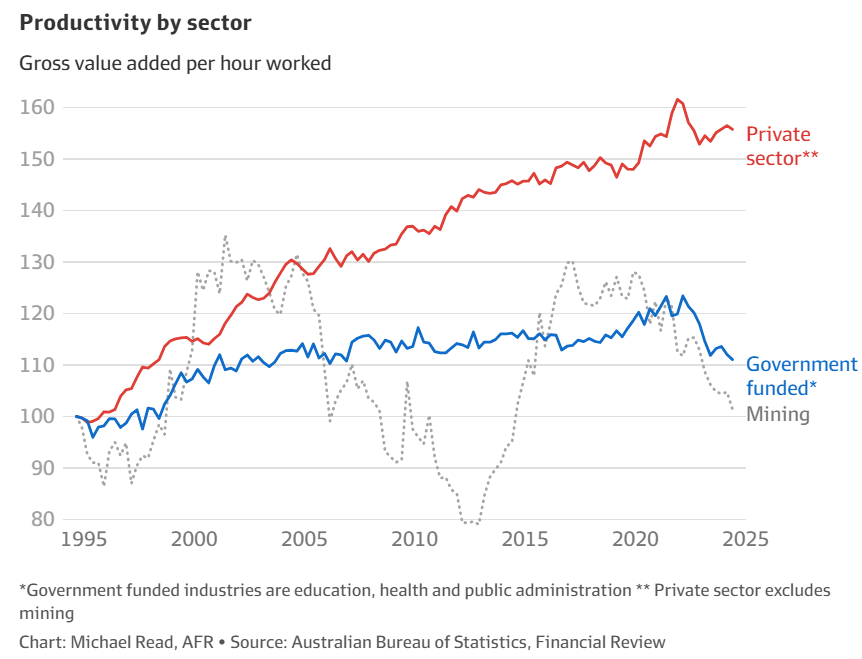
By comparison, productivity in the private (market) sector has risen strongly. Since 2000, productivity in the private sector has improved by 35%, versus minimal (2%) improvement in the government-funded sector.
The healthcare and social assistance industry has been the primary driver of job growth, driven by the expansion of the NDIS, aged care, and the ageing population.
The next chart from CBA shows that employment in the healthcare and social assistance industry has grown much faster in Australia than elsewhere:
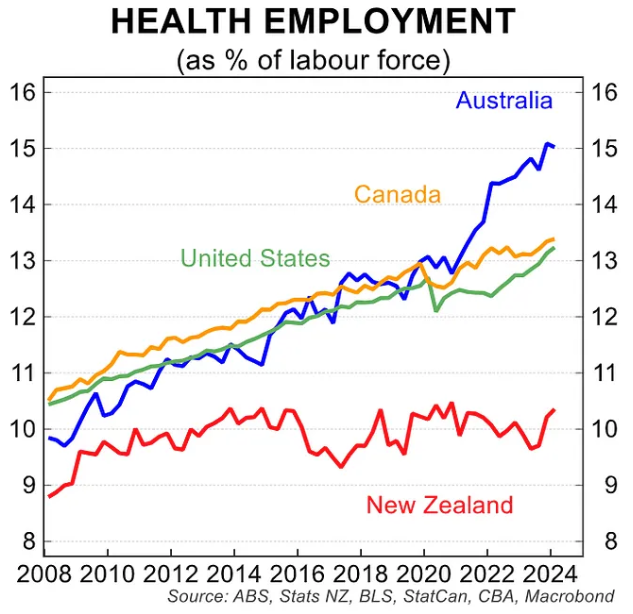
Growth in the healthcare and social assistance industry is likely to continue given the projected expansion of the NDIS:
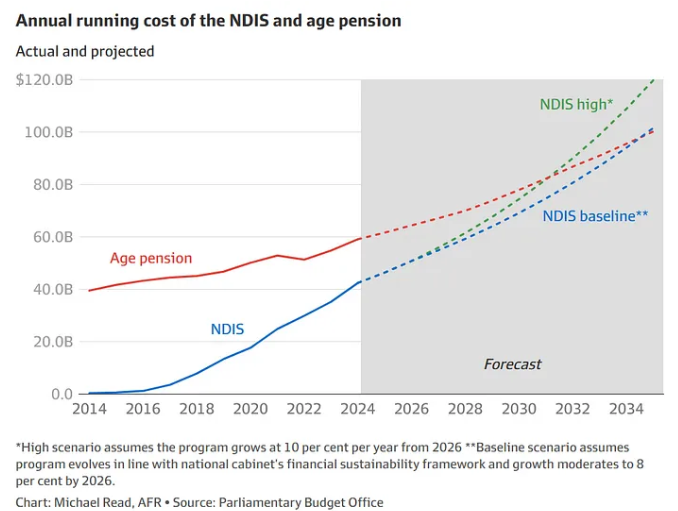
The NDIS currently costs some $42 billion a year to run and has a higher annual operating cost than aged care ($36 billion), Medicare ($32 billion), federal hospital financing ($30 billion), and medicines ($20 billion).
The Parliamentary Budget Office (PBO) projects that the cost of NDIS will rise to around $100 billion in a decade under present settings, meaning it will comprise an increasing share of Australia’s economy.
In turn, Australia faces a massive productivity challenge in the years ahead.
Where will Australia’s productivity growth come from if the government-funded sector continues to dominate employment growth and the nation’s population continues to expand at a faster pace than business and infrastructure investment?
Unless corrective action is taken, Australia faces a low productivity future, a stagflationary economy, and declining living standards.
