
Across the nation, the scope and breadth of housing price falls continue to expand, increasingly prompting forecasts of multi-decade record-high falls in housing prices.
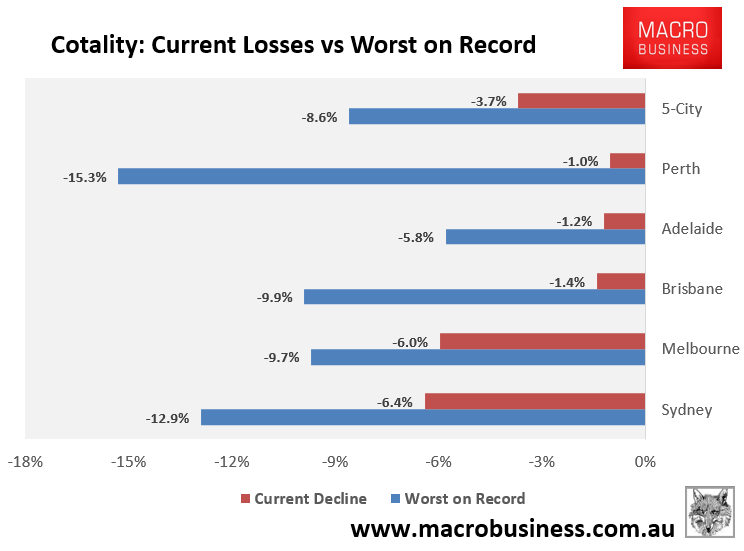
The largest falls among the five major capitals so far this cycle have been in Sydney, where prices are down 6.4% from the peak.
At the other end of the spectrum, the least worst-performing major capital is Perth, where prices have declined 1.0% since the peak.
The auction markets of Melbourne and Sydney have been particularly vulnerable, with auction clearance rates in both cities falling to the lowest levels since the pandemic.
With headline clearance rates from Domain and Cotality distorted by unreported results, I have been collecting my own data since before the pandemic, which provides preliminary insights until the much more complete and concrete data emerges from SQM Research the following Tuesday.
You can find more on my methodology, how it differs, and its value at the bottom of the page.
On my figures, the sold-to-listed clearance rate in Sydney was 31.7% on Saturday evening, with Melbourne at 36.9%.
To put these figures into perspective, on a “normal” weekend this time last year the results were as follows:
- Sydney: 49.0%
- Melbourne: 57.3%
As is swiftly apparent, the market is in a completely different league to where it was even at the start of the year.
But another factor is supporting the market and arguably playing a significant role in preventing clearance rates from tumbling even further: low auction volumes.
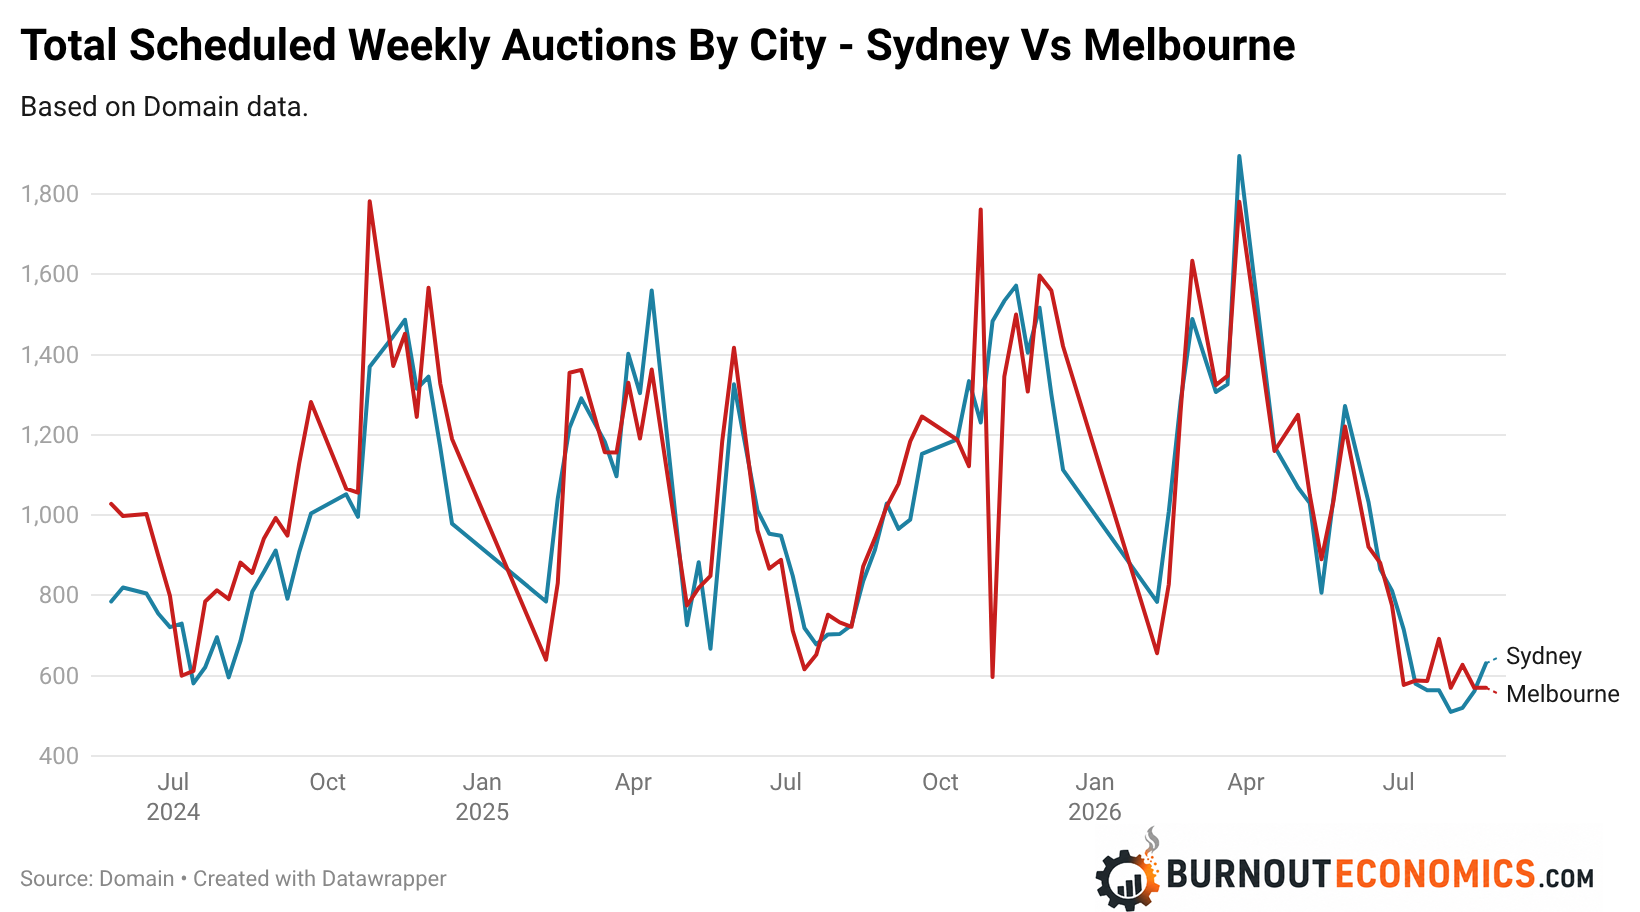
This weekend last year in Sydney there were 914 auctions, with volumes gradually rising robustly as the spring selling season approached, compared with just 631 this year.
The same trend is even more noticeable in the Melbourne market, where auction volumes sat at 943 this time last year, and this year there were just 570 on the market.
The Takeaway
Auction volumes stalling amid a falling market is hardly new, with a similar trend during the 2017 to 2019 home price falls.
While there are naturally other ways to sell a home, the anaemic growth in auction numbers as we head towards the spring selling season is also reflected in major drops in overall transaction volumes.
One of the biggest questions for the housing market going forward is what happens to overall stock levels.
If they continue to rise and push towards normalising to pre-pandemic levels nationally, then the housing market will face yet another headwind at a time when some markets are already facing a cold gale blowing in their direction.
Some details on the methodology:
The normal headline clearance rates that appear in the media on a Saturday evening or a Sunday are calculated by dividing the total number of properties reported sold by the number of auctions with reported results.
Many moons ago, this was a rather unproblematic metric, with results chased up by the likes of a younger Louis Christopher, who is now the Managing Director of SQM Research.
But with legions of auction results going missing when the preliminary clearance data is released, my figures fill the gap.
While they are far from the gold standard provided by SQM Research on a Tuesday afternoon, they arguably provide significantly more insight than the headline results and have been shared by some of the top property analysts in the country, as well as quoted in the mainstream media.
The difference is my figures take the total number of properties sold and divide it by the total number of scheduled auctions, instead of solely the instances where a result has been reported.
It’s far from ideal, but it’s better than the other options on offer on a Saturday evening.
