
Well its going to be another interesting trading week to say the least with a flat session on Wall Street ahead of their long weekend holiday, while the rest of the world has to again adjust to a new world order where Europe and the US could be going to war. It will be a trade war at first over Greenland as the Trump regime bullied the EU with more tariffs over its forced annexation while over the weekend the EU has responded with a cessation of its recent trade deal and a possible use of the anti-coercion powers. For markets we could see some major ructions in bonds and currencies with equity futures flat so far. The USD firmed on Friday against most of the majors, particularly Euro while precious metal prices stabilised as the Australian dollar remains below the 67 cent level.
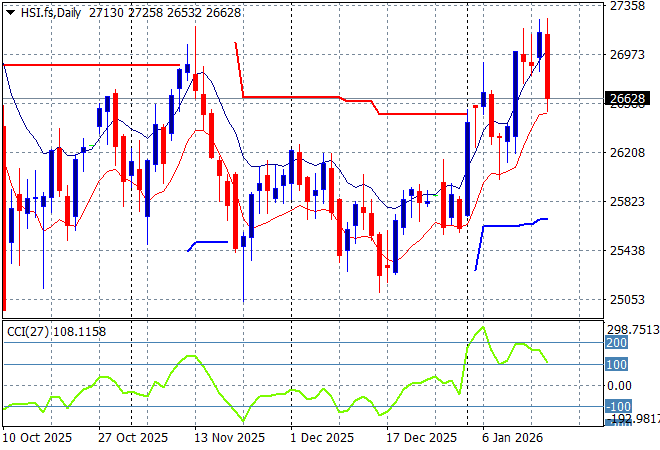
Looking at stock markets from Asia from Friday’s session, where mainland Chinese share markets went nowhere in the afternoon session with the Shanghai Composite falling 0.2% lower to almost break the 4100 point level while the Hang Seng Index fell a similar amount to close the week out just below the 27000 point level.
The daily chart of the Hang Seng Index showed a lot of wish washy action around the 26000 point level in the last couple of months with some recent weakness now turning into strength. The latest small bounce off support does have more momentum brewing but is facing resistance overhead:
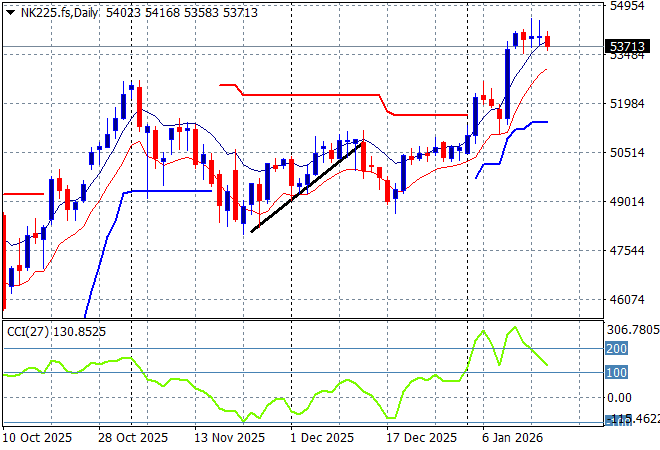
Japanese stock markets were in mild retreat with the Nikkei 225 down nearly 0.4% to stay below the 54000 point level.
Daily price action wavered a little during the BOJ hike in the previous weeks but has firmed up strongly with the 50000 point level forming key support although it has gotten ahead of itself. This looks like a launch point through longer term overhead resistance:
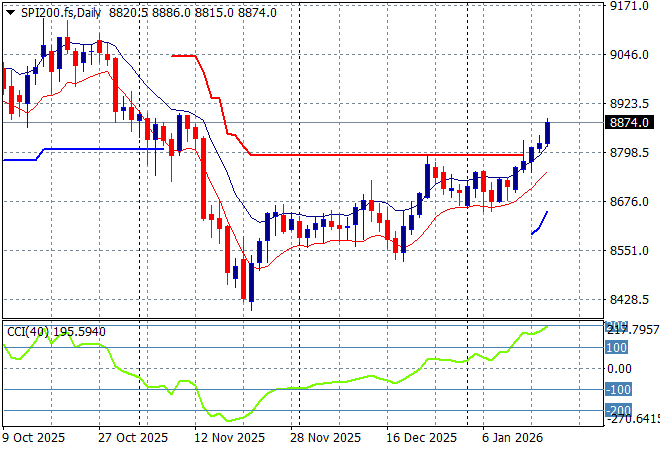
Australian stocks were again the best performers in the region with the ASX200 lifting nearly 0.5% to 8903 points. SPI futures however are off only slightly due to another staid session on Wall Street on Friday night.
The daily chart pattern shows that short term support has been reinforced after a period of hesitation before Christmas with a bounceback above resistance at the 8800 point area now building:
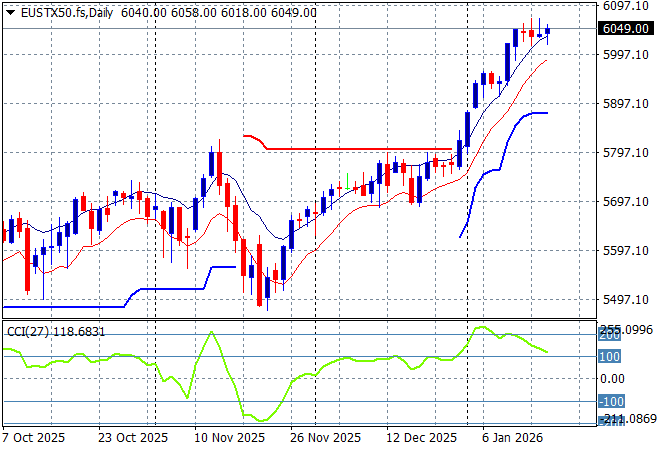
European markets failed to comeback again with mild losses across the continent as the Eurostoxx 50 Index closed 0.2% lower to 6029 points, still keeping the recent rally intact but indicating more resistance building.
The market had been failing to make headway in recent months due to the too high valuations but short term support was very solid and has pushed well above recent highs to start 2026 with some gusto, helped by a much lower Euro:
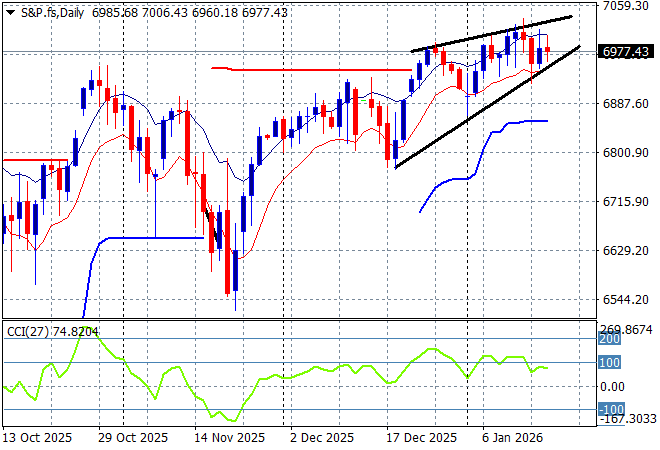
Wall Street was unable to eke out any positive returns with both the NASDAQ and the S&P500 losing 0.1% each with the latter closing at 6940 points.
The daily chart showed a belated Santa rally that took back some of the gains to match the November highs but a lift up towards the 7000 point level is still being thwarted by geopolitical and other risk factors with a bearish rising wedge pattern almost fully formed:
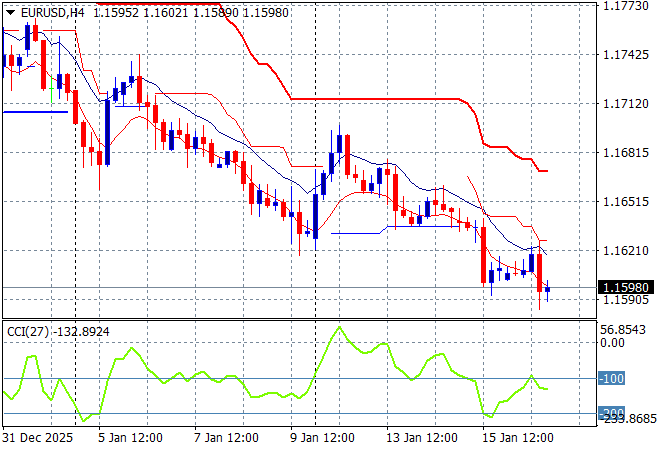
Currency markets continue to fail to reverse their pre-Xmas move against King Dollar as macro concerns over Iran/Venezuela/Greenland etc turn into a full safe haven play. The USD continued to firm against Euro in particular which was pushed below the 1.16 level with other majors also weakening across the board.
The union currency had already been pushed down to the 1.17 handle during the Xmas period and after a small bounceback put on a dead cat bounce here as the end of NATO looms on the horizon. Watch for a sustained break below the recent lows at the 1.16 level next:
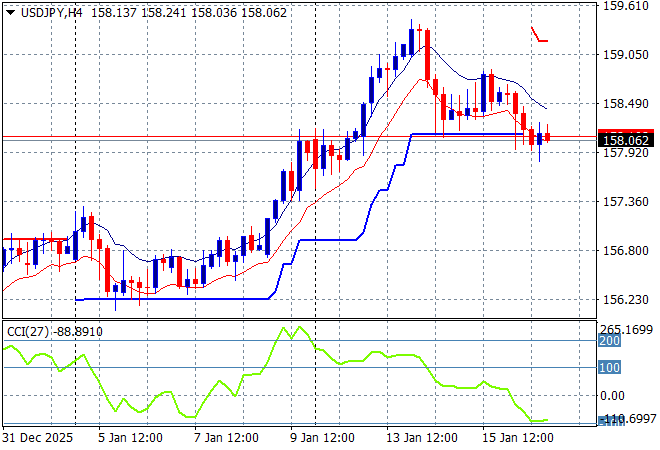
The USDJPY pair pushed well above the 157 handle on the new year sessions, despite stronger inflation in Japan with a move above the 159 level at the start of the week turned into a reversal back down to the 158 level.
The previous price action was sending the pair beyond the March highs and had the potential to extend those gains through to start of year position at the 158 handle. A little too much heat has been taken out after being overbought :
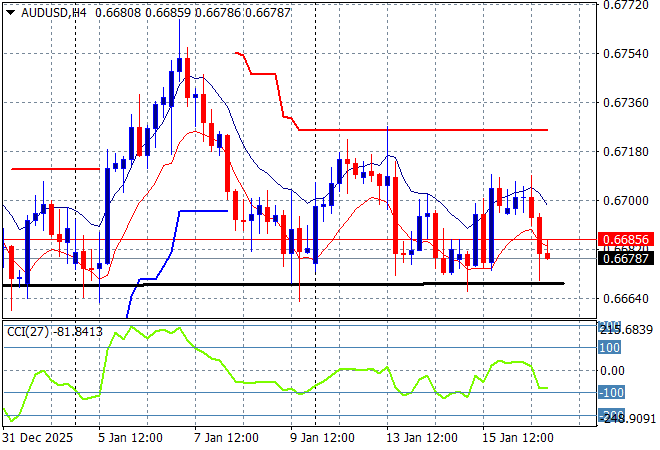
The Australian dollar was pushed down to the 67 handle on the NFP print last week before a small bounce like all the other undollars on the Powell putdown but has since reversed although it is respecting support (big black horizontal line below) albeit with another failed attempt to get back above the 67 level on Friday night.
Price action was not looking good for the Pacific Peso in the medium term as the interest rate differential squeeze sent it back to the doldrums, but short term support is barely shoring up again so I don’t see a lot of upside here:
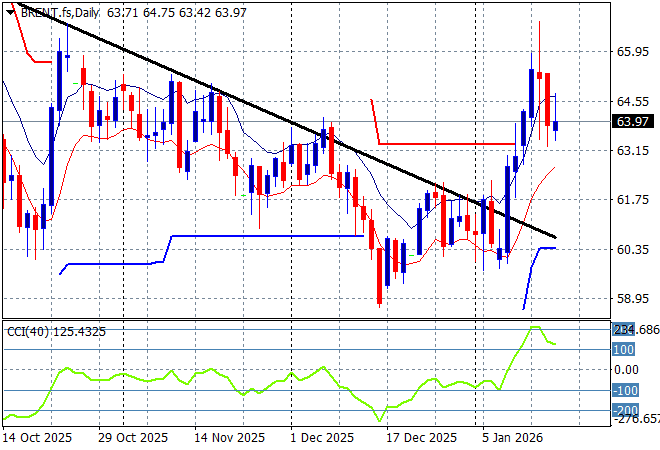
Oil markets have been on a multi week/monthly downtrend prior to the Venezuelan invasion but shot out of the gate last week with some big gains before getting ahead of itself. Brent crude back below the $64USD per barrel with the potential for more falls if the Trump regime doesn’t start shooting soon.
The daily chart pattern shows an extended downtrend that is now well under threat and broken in the short term so watch for this to potentially turn into a proper reversal although it is well over extended in the short term:
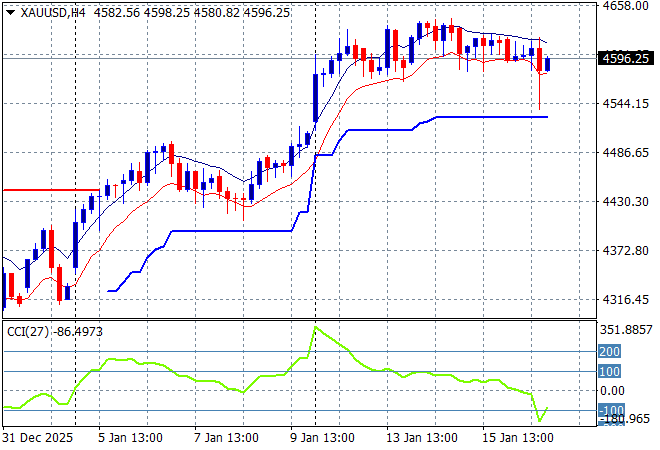
Gold is in a holding pattern, albeit with a very bullish bias above the $4600USD per ounce level after some heat was taken out of silver prices in the last couple of sessions. But its pretty clear that gold is becoming a Minsky Metal yet again…
As I previously mentioned that after some stability, another large upside potential move was looming again for the shiny metal as the desire for USD dwindles and here we are, albeit very overbought as short term resistance forms slightly:
Glossary of Acronyms and Technical Analysis Terms:
ATR: Average True Range – measures the degree of price volatility averaged over a time period
ATR Support/Resistance: a ratcheting mechanism that follows price below/above a trend, that if breached shows above average volatility
CCI: Commodity Channel Index: a momentum reading that calculates current price away from the statistical mean or “typical” price to indicate overbought (far above the mean) or oversold (far below the mean)
Low/High Moving Average: rolling mean of prices in this case, the low and high for the day/hour which creates a band around the actual price movement
FOMC: Federal Open Market Committee, monthly meeting of Federal Reserve regarding monetary policy (setting interest rates)
DOE: US Department of Energy
Uncle Point: or stop loss point, a level at which you’ve clearly been wrong on your position, so cry uncle and get out/wrong on your position, so cry uncle and get out!