
Friday night was a tale of two jobs reports – Canadian and American – with the latter NFP print coming in weak again although the headline unemployment number fell, giving USD a boost eventually after a volatile session. All the action was really in precious metals and commodities as geopolitical risk hots up across Iran plus the Trump regime’s campaign to dominate its hemisphere. Wall Street put in a solid final session for the trading week, trying to get back to recent highs which should give a push for Asian stocks on the open on Monday. The Euro remains under a lot of pressure as does Pound Sterling and the Canadian Loonie while the Australian dollar remains below the 67 cent level.
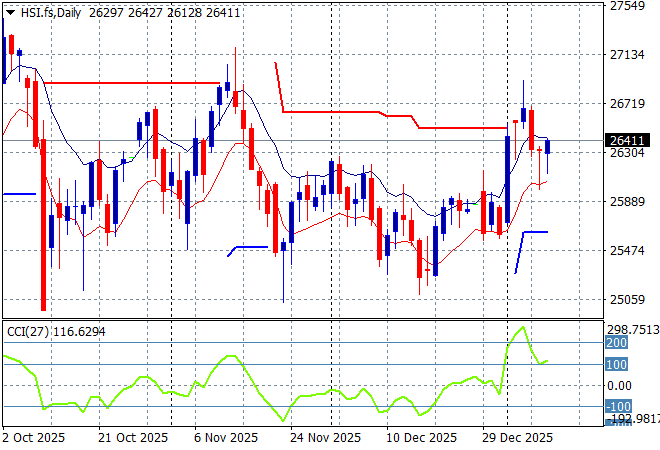
Looking at stock markets from Asia from Friday’s session, where mainland Chinese share markets did better in the afternoon session with the Shanghai Composite up nearly 1% to 4120 points while the Hang Seng Index has lifted only 0.3% to stay above the 26000 point level.
The daily chart of the Hang Seng Index showed a lot of wish washy action around the 26000 point level in the last couple of months with some recent weakness now turning into strength. The latest small bounce off support does not have a lot of momentum:
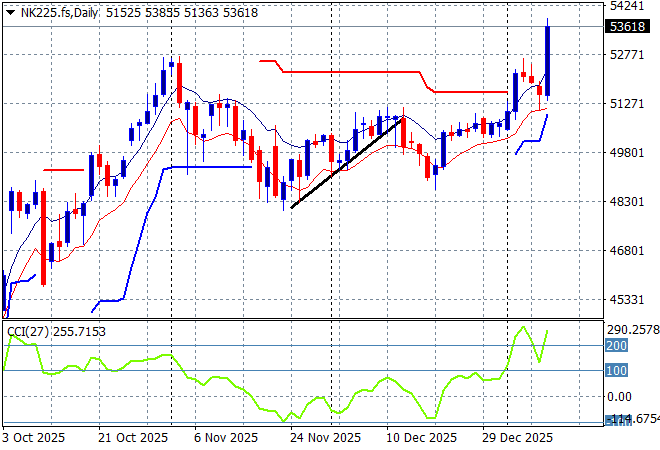
Japanese stock markets also saw a bounceback with the Nikkei 225 closing 1.5% higher at 51939 points.
Daily price action wavered a little during the BOJ hike in the previous weeks but has firmed up strongly with the 50000 point level forming key support although it has gotten ahead of itself. This looks like a launch point through longer term overhead resistance:
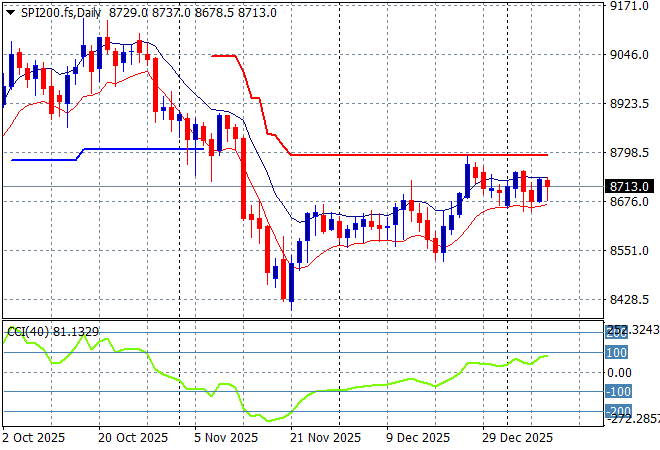
Australian stocks were the standout again but for the wrong reasons as the ASX200 went nowhere, closing at 8717 points. SPI futures are up nearly 0.4% with a good showing on Wall Street from Friday night hopefully moving things higher.
The daily chart pattern shows that short term support has been reinforced after a period of hesitation before Christmas with a bounceback above resistance at the 8800 point area still possible:
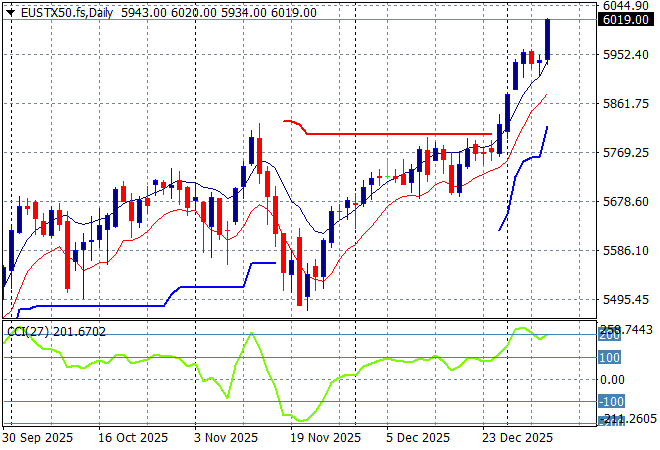
European markets were the standout on Friday with a big upside session across the continent as the Eurostoxx 50 Index closed 1.5% higher at 5997 points.
The market had been failing to make headway in recent months due to the too high valuations but short term support was very solid and has pushed well above recent highs to start 2026 with some gusto as a new breakout accelerates:
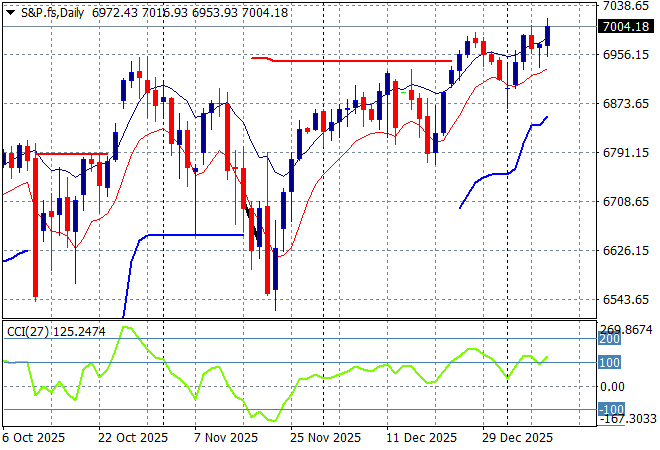
Wall Street also managed to move higher across the board with the NASDAQ lifting more than 0.8% while the S&P500 gained 0.6% to close the week out at 6966 points.
The daily chart showed a belated Santa rally that took back some of the gains to match the November highs but it still looking well supported on the four hourly chart below with the potential to lift up towards the 7000 point level next:
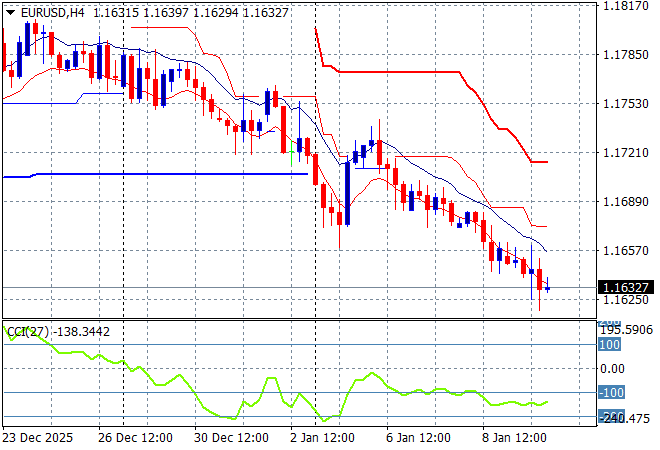
Currency markets have failed to reverse their move against King Dollar as the December NFP print came to pass on Friday, without the anticipated Supreme Court ruling on tariffs. The weak print with even weaker prior revisions did not upset the apple cart with USD eventually strengthening against most of the majors as Euro deflated back towards the 1.16 handle alongside a slightly weaker Pound Sterling.
The union currency was pushed down to the 1.17 handle during the Xmas period and after a small bounceback put on a dead cat bounce here as the end of NATO looms on the horizon. Watch for a break below the recent lows at the 1.16 level next:
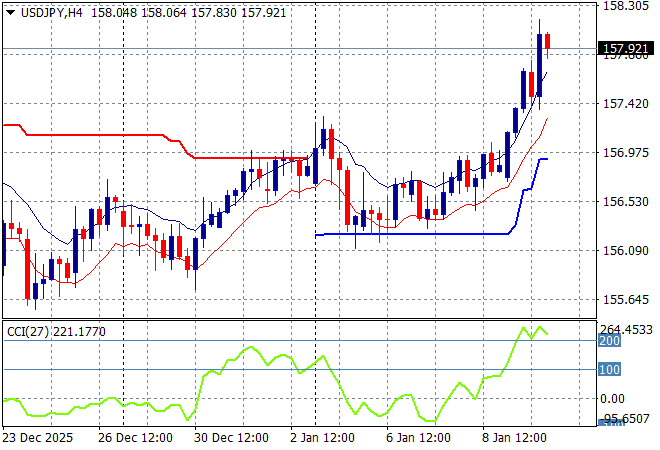
The USDJPY pair pushed well above the 157 handle on the new year sessions, gave it all back and then accelerated higher again despite stronger inflation in Japan with a move towards the 158 level on Friday night.
The previous price action was sending the pair beyond the March highs and had the potential to extend those gains through to start of year position at the 158 handle. This is now slightly overbought but has more upside potential:
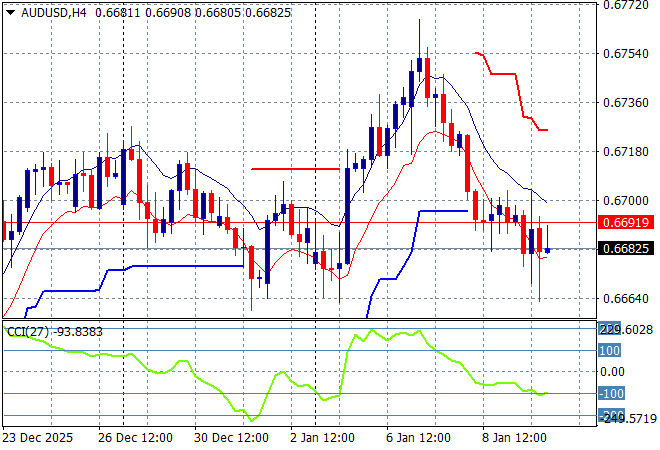
The Australian dollar was weakening throughout the pre NY period but found support at the mid 66 level where it broke out on commodity volatility but has weakened slightly down to the 67 handle on the NFP print on Friday night.
Price action was not looking good for the Pacific Peso in the medium term as the interest rate differential squeeze sent it back to the doldrums, but short term support is shoring up again:
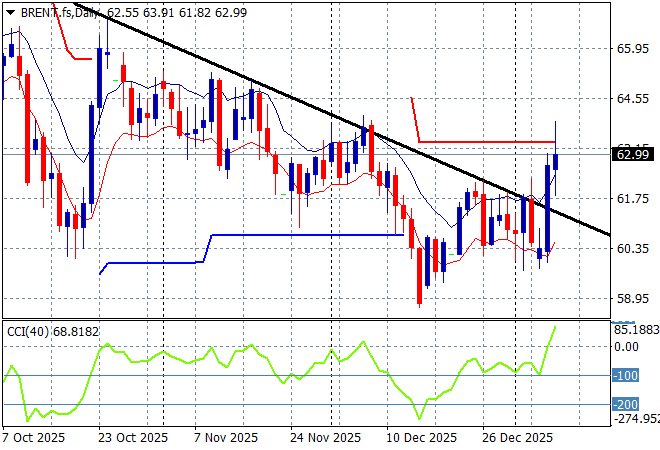
Oil markets have been on a multi week/monthly downtrend prior to the Venezuelan invasion with not much upside thereafter, although things are brewing as Brent crude shot up above the $62USD per barrel mid week on the Iranian protests and smaller US trade deficit.
The daily chart pattern shows an extended downtrend that is coming under threat but watch for this to potentiate out as a false break:
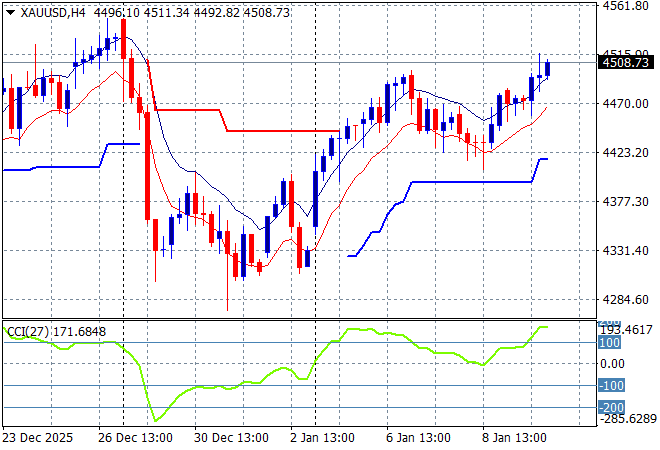
Gold had been using the $4300USD per ounce level as strong support throughout the NY/Xmas period and made a comeback on USD weakness as it broke out above the $4500USD per ounce level on Friday night.
As I previously mentioned that after some stability, another large upside potential move was looming again for the shiny metal as the desire for USD dwindles and here we are, albeit very overbought as short term resistance forms slightly:
Glossary of Acronyms and Technical Analysis Terms:
ATR: Average True Range – measures the degree of price volatility averaged over a time period
ATR Support/Resistance: a ratcheting mechanism that follows price below/above a trend, that if breached shows above average volatility
CCI: Commodity Channel Index: a momentum reading that calculates current price away from the statistical mean or “typical” price to indicate overbought (far above the mean) or oversold (far below the mean)
Low/High Moving Average: rolling mean of prices in this case, the low and high for the day/hour which creates a band around the actual price movement
FOMC: Federal Open Market Committee, monthly meeting of Federal Reserve regarding monetary policy (setting interest rates)
DOE: US Department of Energy
Uncle Point: or stop loss point, a level at which you’ve clearly been wrong on your position, so cry uncle and get out/wrong on your position, so cry uncle and get out!