
When Australia closed the book on the 20th century, the median home at a national level could be purchased by a household with a median household income.
The typical mortgage consumed 25% of gross income, assuming they had the cash for a 20% deposit, stamp duty, and other transaction costs.
This marked the last ‘hurrah’ for affordable housing at the national level, with home affordability never returning to its previous level.
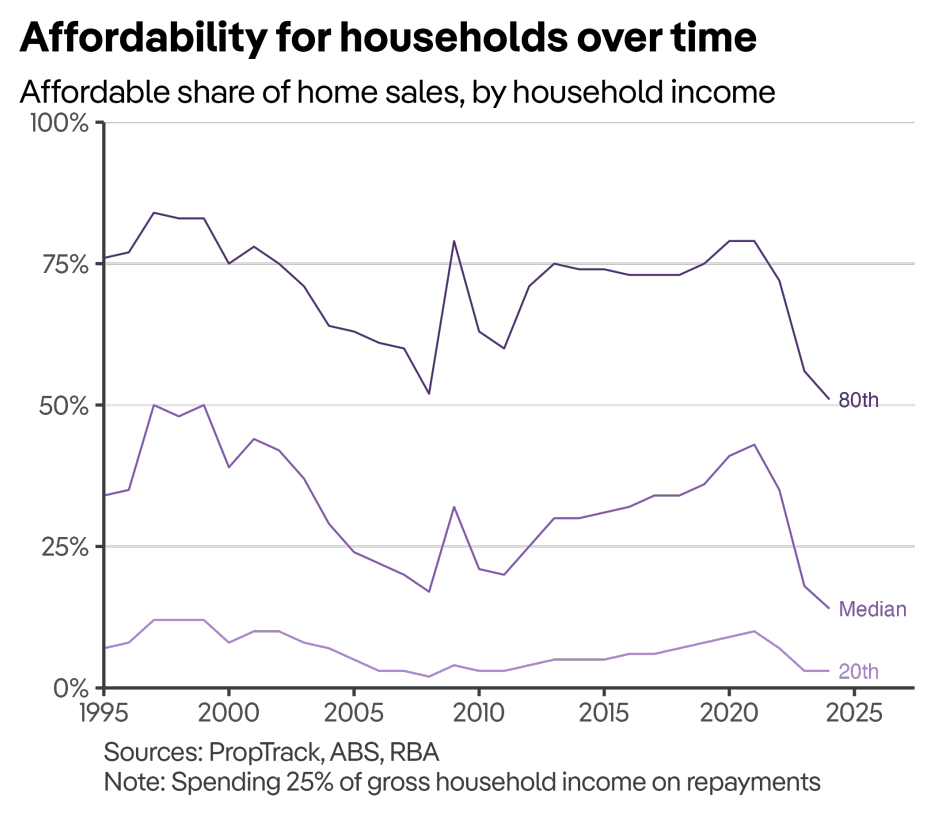
While the next 25 years would see affordability under this metric improve, it would also see the size of the deposit hurdle relative to incomes get larger and larger.
An analysis from AMP revealed that the time to save a deposit rose from around five and a half years in 1999 to more than a decade in the present.

The fact that Australian homes have become increasingly unaffordable is no secret. First the rise in prices and then the rise in interest rates dealt significant blows to the fortunes of prospective home buyers.
Which raises a key question: what would it take to get home prices back to anything like where they were just prior to the turn of the millennium?
There are numerous ways to achieve this, and the methods for securing affordable homes remain a subject of continuous discussion.
But HIA has done the numbers on what it would take if housing supply could magically be brought to market in an instant, calculating how many additional homes it would take to get home prices back to a level where a single person on an average full-time wage could afford to buy the median home and avoid technical mortgage stress (mortgage repayments at 30% or more of household income).
The scenario assumes that the buyer is single and makes $106,000 per year.
It is worth noting that the average full-time income is somewhat abstract; it is simply what it says it is: total full-time incomes divided by the total number of full-time earners.
Median full-time earnings are almost $18,000 per year less, coming in at $88,400 per year.
According to their calculations, it would require an additional 1.9 million homes or a 16% expansion of housing stock overnight.
Under their scenario it would lower the national average home price by 40% to $464,300.
Based on a somewhat rough estimate of median household income nationally, it is only marginally higher than average full-time earnings. This means that this analysis and the one from PropTrack are not too far removed from each other.
The major difference is that the PropTrack methodology defines affordability as 25% of gross household income, while HIA assumes 30% of household income.
Which raises a rather interesting and deeply concerning point of comparison: housing prices could crash by 40% and the median house nationally would still be less affordable than it was in 1999.
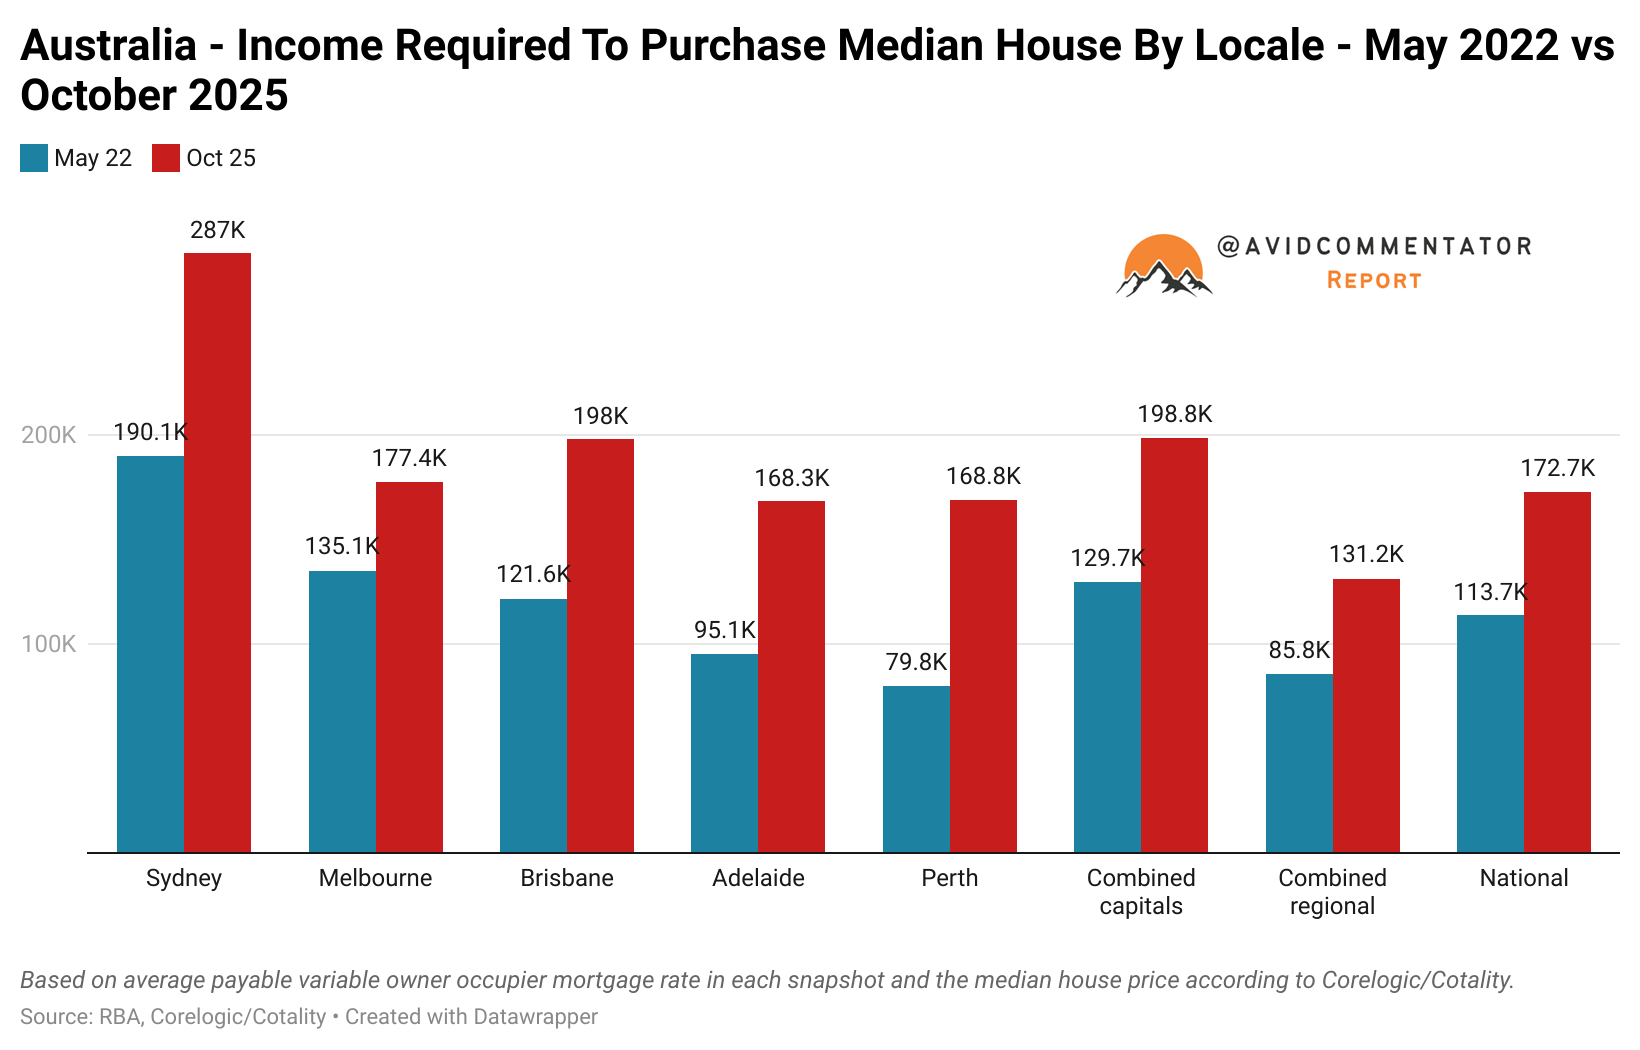
A chart of the income required to purchase the median house clearly shows how the challenge has evolved over time, even for those who possess a 20% deposit.
Ultimately, housing affordability has deteriorated significantly since the last days of the 20th century and without a major blow to home prices, that type of affordability will not be coming back any time soon.
