
Yet again Wall Street only rallied overnight due to tech giants as the AI bubble keeps the mirage of everything afloat. The USD is holding firm against all the majors although is making new ground against Kiwi and the Canadian Loonie while the Australian dollar is just holding on above the 65 cent level. Remember its the most important day on the gambling calendar, with the November RBA meeting looming large this afternoon as punters wonder if they can make bank on the Great Australian Housing Bubble.
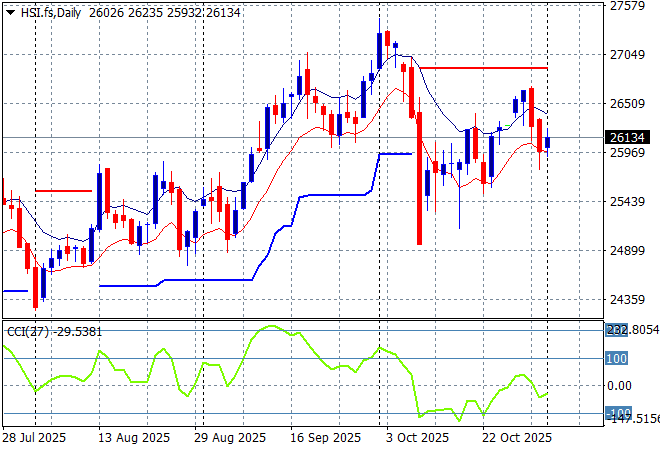
Looking at stock markets from Asia from yesterday’s session, where mainland Chinese share markets managed to rally going into the close with the Shanghai Composite up 0.5% but still stuck below the 4000 point barrier while the Hang Seng Index bounced nearly 1% higher to close at 26158 points.
The daily chart of the latter showed a complete fill of the March/April selloff and then some with a breakout above the 26000 point level looking like a sustained move here before the most recent Trump tantrum. The trade deal is seeing a resumption of buying here above 26000 points but I’m very cautious here due to lack of momentum:
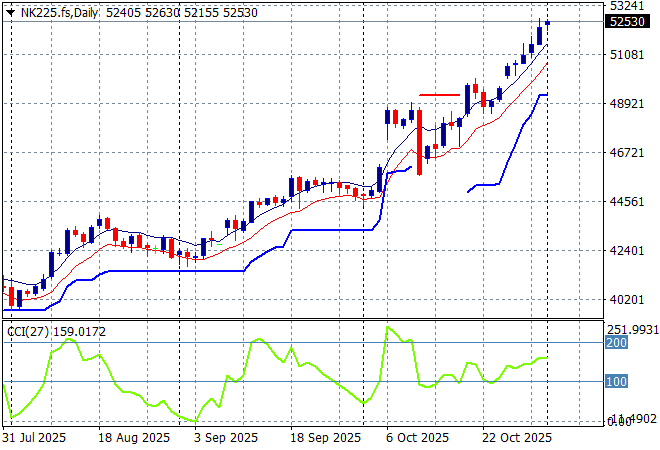
Japanese stock markets were closed for yet another holiday with the daily Nikkei 225 chart looking quite overblown above the 52000 point level.
Daily price action was looking extremely keen indeed as daily momentum accelerated after clearing resistance at the 42000 point level with another equity market that looks very stretched and breaking out a bit too strongly here. ATR support has been ratcheting up for awhile as the 50000 point level is now broken for an extended rally:
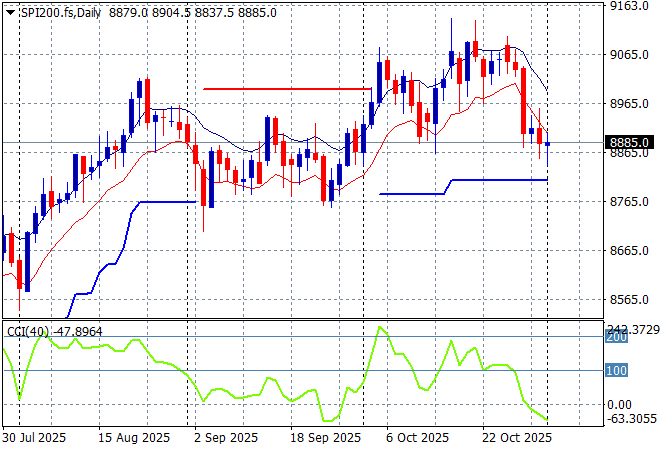
Australian stocks were still unable to find any positive momentum with the ASX200 finishing nearly dead flat at 8894 points. SPI futures are down 0.2% or so despite Wall Street lifting overnight.
The daily chart pattern was suggesting further upside still possible with a base built above the 8700 point level as daily momentum tried to maintain its overbought status. Short term support is just holding on, but the momentum is just not here and the punchbowl has been taken away:
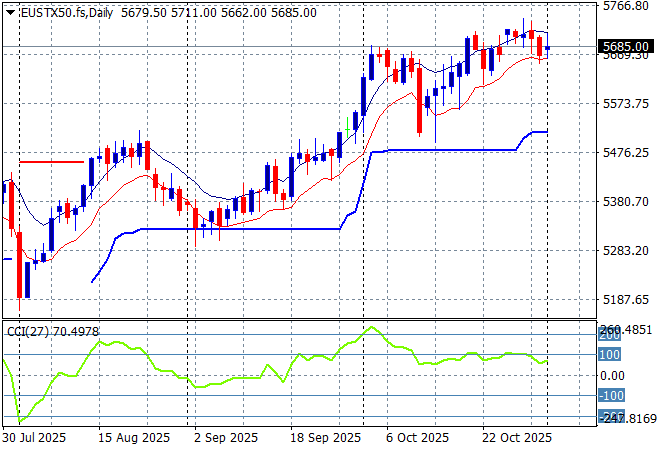
European markets were able to make some mixed gains across the continent with the German DAX the main contributor as the Eurostoxx 50 Index closed 0.3% higher at 5679 points.
Weekly support has been respected after a brief touch below the 5200 point level as the recent rebound on Euro weakness shows a complete fill. However the market was looking to make some good headway here despite the too high valuations but upside potential looks fleeting for now:
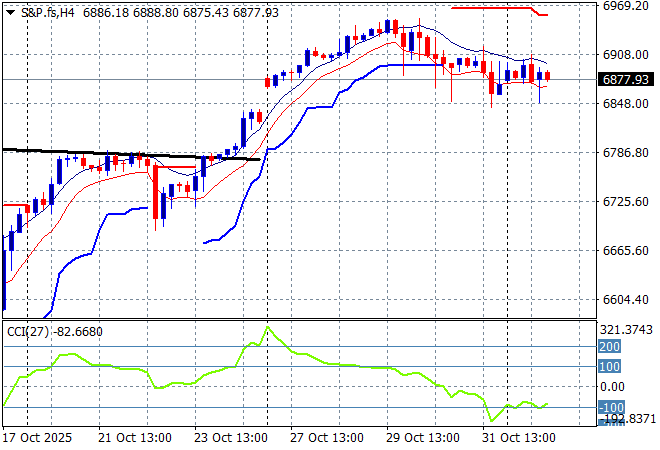
Wall Street continues to be held up by tech stocks alone with the NASDAQ up nearly 0.5% while the S&P500 finished just 0.1% higher at the 6851 point level.
The four hourly chart shows the recent breakout after last week’s CPI print but then a lack of momentum after the Fed spiked the punchbowl. Watch for a potential retracement that could extend back to the 6800 point level where the last swap of support/reversal occurred:
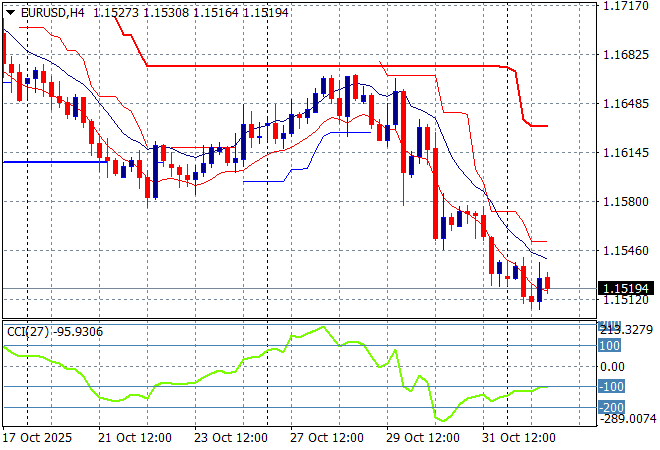
Currency markets are still reeling from the actions and words of the Fed meeting last week, which saw the USD eventually push back against everything after the December cut expectations were almost eliminated. Overnight saw some consolidation as Euro stabilised at the 1.15 level while the Canadian Loonie continued to move lower.
The union currency had been building strength prior to the recent bad domestic economic news from the US overshadowed any continental slowdown but had reversed that trend in recent weeks. The potential breakout above the 1.17 level was getting more traction however momentum had slowed down before the Fed cut so watch for more downside here:
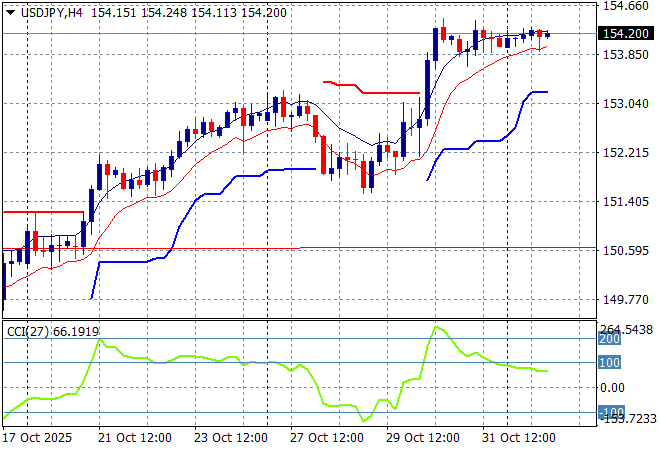
The USDJPY pair put in a consolidation phase before rallying on the Fed cut, which has now seen it surge up to the 154 level to extend well past its start of week retracement starting point but due to the holiday in Japan yesterday has seen little action.
The previous price action was sending the pair beyond the March highs and had the potential to extend those gains through to start of year position at the 158 handle and this recent volatility is wanting to repeat this move:
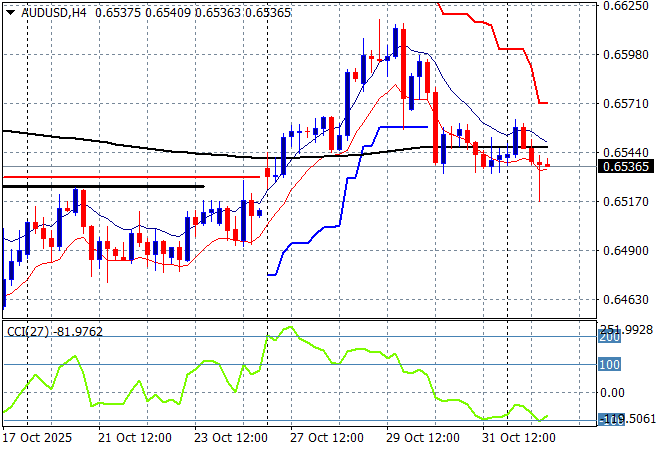
The Australian dollar had on a breakout above the 65 cent level recently but last week’s Fed cut/wait approach saw it first blip above the 66 level briefly before slammed back to the mid 65 handle where it stayed on Friday night. Overnight saw it steady around that level but downside momentum is building.
This could become a more sustained breakdown if the China/US trade war heats up as I’ve opined that the Pacific Peso is not out of trouble although I’m wary of a lot of volatility here, with a re-visit down to the 64 level not unlikely:
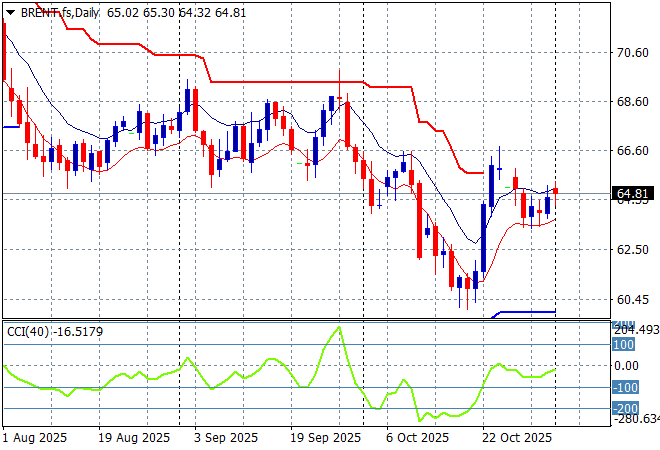
Oil markets got a wriggle on last week due to a surprise drawdown in US inventories but after the usual overshoot some stability has returned with Brent crude remaining around the $64USD per barrel level on Friday night.
The daily chart pattern shows the post New Year rally has a distant memory with any potential for a rally up to the $80 level completely dissipating. There was potential here for a run down to the $60 level next but wait and see if this one off bid turns into a trend:
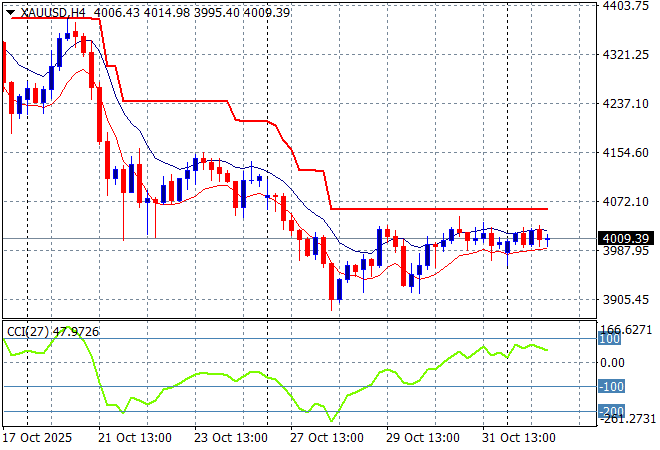
Gold is doing to better to stabilise after a well needed correction down towards the $3900USD per ounce level recently, with a small bounceback late last week getting it back above the $4000 area, possibly setting up a comeback.
I noted a short term potential double top pattern forming here on the four hourly chart and that these falls could extend well below the $4000 level but watch for a potential rebound above ATR resistance here:
Glossary of Acronyms and Technical Analysis Terms:
ATR: Average True Range – measures the degree of price volatility averaged over a time period
ATR Support/Resistance: a ratcheting mechanism that follows price below/above a trend, that if breached shows above average volatility
CCI: Commodity Channel Index: a momentum reading that calculates current price away from the statistical mean or “typical” price to indicate overbought (far above the mean) or oversold (far below the mean)
Low/High Moving Average: rolling mean of prices in this case, the low and high for the day/hour which creates a band around the actual price movement
FOMC: Federal Open Market Committee, monthly meeting of Federal Reserve regarding monetary policy (setting interest rates)
DOE: US Department of Energy
Uncle Point: or stop loss point, a level at which you’ve clearly been wrong on your position, so cry uncle and get out/wrong on your position, so cry uncle and get out!