

New record highs for Wall Street and Bitcoin as the latest US weekly initial jobless numbers weren’t as high as expected, giving USD another lift against most of the undollars. However, the Australian dollar rallied on more Chinese stimulus speculation while
Lots of auctions in the US Treasury market saw 10 year yields dip lower as expectations of a July rate cut at the next FOMC meeting are likely dashed on the jobs print.
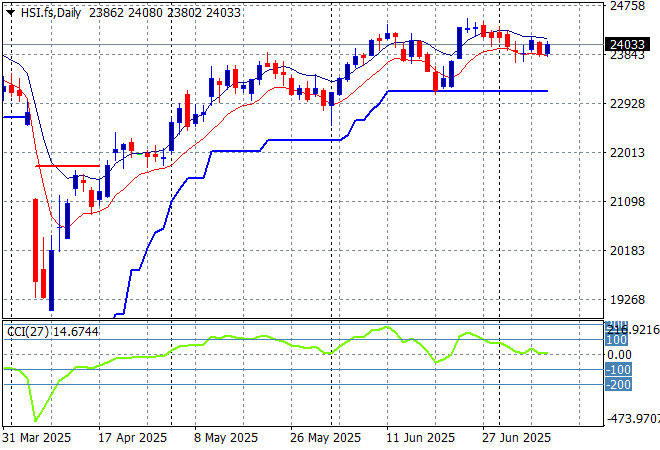
Looking at stock markets from Asia from yesterday’s session, where mainland Chinese share markets were up with the Shanghai Composite pushing above the 3500 point level while the Hang Seng took a breather after some recent losses to remain below the 24000 point level.
The daily chart shows a near complete fill of the March/April selloff although momentum has now reversed after being slightly overbought as price action meets trailing support at the 23000 point level. This was looking like a strong bounceback with firm support at the 23000 point level as a springboard but resistance is building into a rollover here:
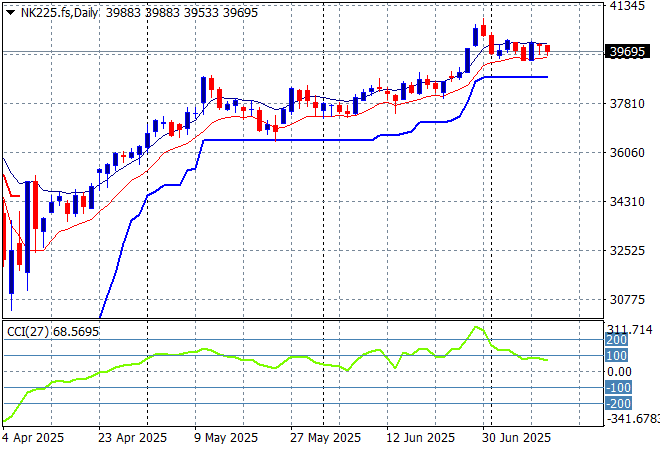
Meanwhile Japanese stock markets were somewhat negative as the Nikkei 225 retreated below the 40000 point barrier to close 0.4% lower at 39646 points.
Daily price action was looking very keen indeed as daily momentum has accelerated after clearing resistance at the 36000 point level with another equity market that looks very stretched and breaking out a bit too strongly here. Watch ATR support continue to ratchet up but also for this rally to have a pullback:
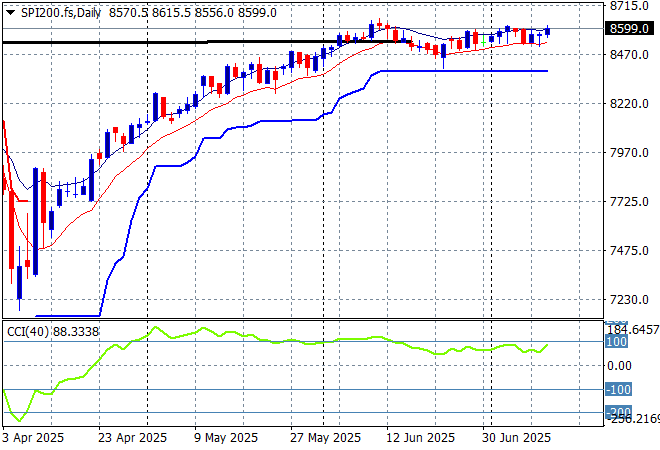
Australian stocks were the best ones in the region with the ASX200 lifting more than 0.6% higher to close at 8569 points. SPI futures are up nearly 0.5% due to the rebound on Wall Street overnight.
The daily chart pattern is still suggesting further upside is still possible as the inverted head and shoulders pattern is nearly complete with the RBA cut helping boost this but correlation with other risk markets will come into play here – watch as daily momentum has eased off from its slightly overbought status but still very positive:
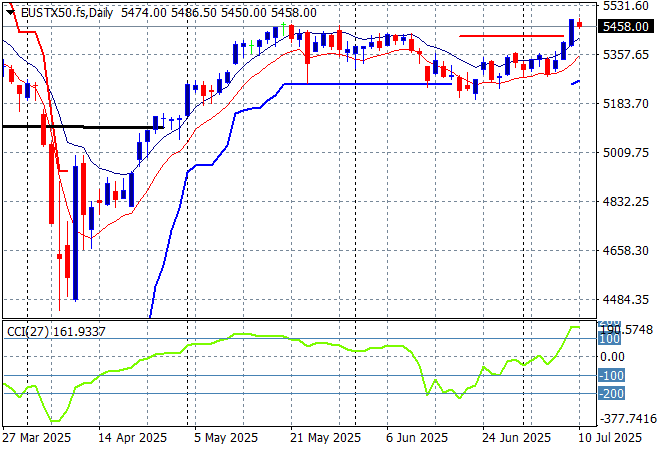
European markets were very uneasy following their recent strong rebound with almost no gains across the continent while the FTSE surged as the Eurostoxx 50 Index eventually closed just 0.1% lower at 5438 points.
Weekly support hasn’t moved in a few months but it was never fully breached, giving time for the market to build a base and breakout here back to the pre “Liberation Day” highs. This looks like a strong, if somewhat overdone breakout with very positive momentum to the upside but watch for a small retracement on any Trumpian volatility:
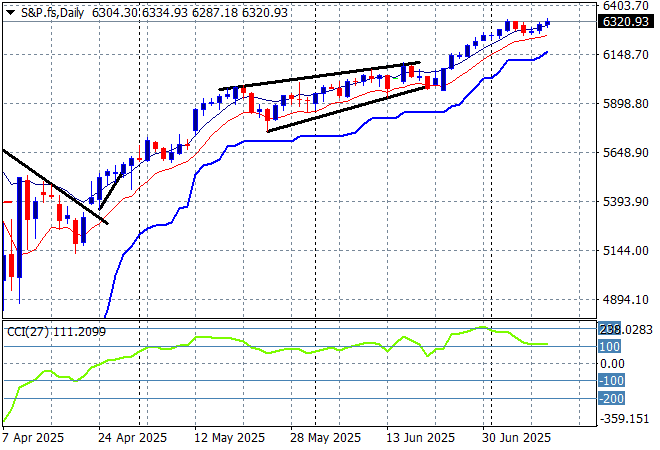
Wall Street made some small gains to new record highs with the NASDAQ up only 0.1% while the S&P500 lifted some 0.3% higher to finish at 6280 points.
A big beautiful bounceback was seeing the 6000 point level brushed aside as everyone bought everything as the asset owners all got their tax cuts entrenched forever and a day. It was looking like another manufactured dip is underway here with the new round of stalled tariffs but we could be seeing another attempted breakout:
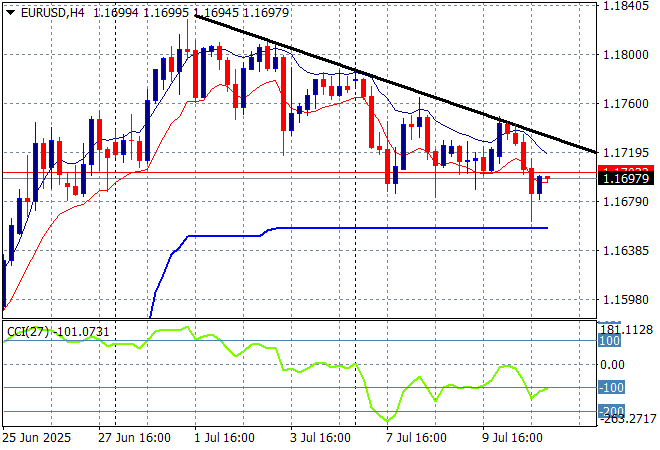
Currency markets had been selling off King Dollar but are facing some headwinds and confusion around the direction of the Fed with the latest minutes potentially signalling rate cuts later in the year. Euro was unable to hold above the 1.17 level for a slight retracement while Pound Sterling also returned to its two week low in near lockstep.
The union currency has been building strength continuously as bad domestic economic news from the US overshadowed any continental slowdown. Medium term and short term momentum was in its favour but this could be turning into a proper reversal so watch support at the 1.1650 mid level next:
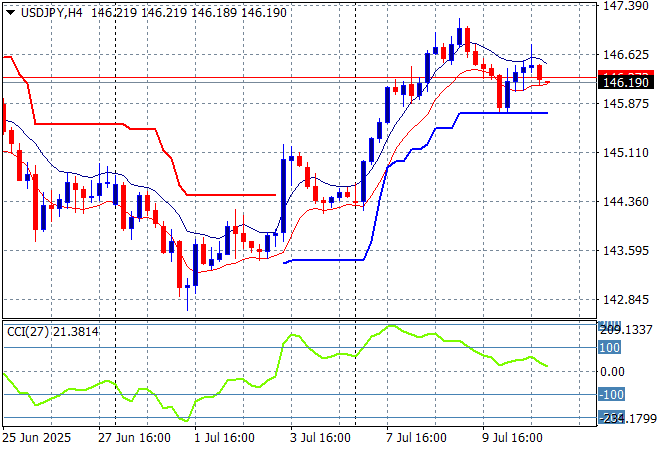
The USDJPY pair recently passed through the 147 handle but became overstretched and continues to settle back at the low 146 level overnight.
I still contend we need to watch for any sustained break below the 139 level which completes a multi year bearish head and shoulders setup that could see the 110 to 120 level revisited. However we could see this one off reaction to the NFP and tariffs push into a false rally up to the 148 level just as we did in June, so watch out for TACO:
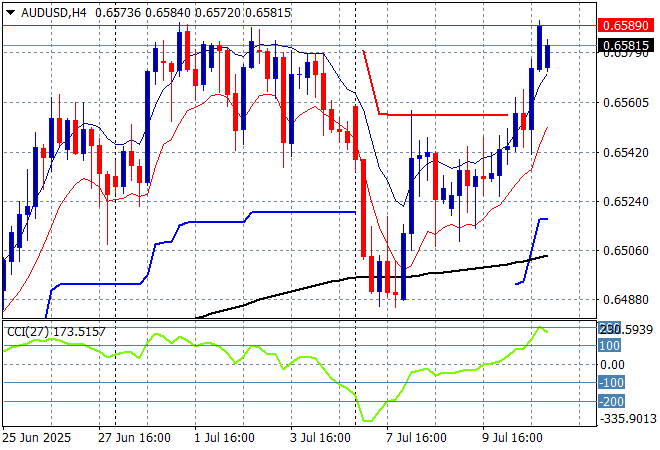
The Australian dollar was relatively weak going into the RBA meeting after looking like holding on to the 65 handle but the surprise hold saw a sign of life return to the Pacific Peso as it built to a proper breakout up to the 66 cent level overnight on the back of Chinese stimulus.
Stepping back for a longer point of view (and looking at the trusty AUDNZD weekly cross) price action has remained supported by the 200 day MA (moving black line) after bouncing off a near new five year low. Keep an eye on temporary support at the 63 cent level and also the series of lower highs in recent weeks of signs of less internal support:
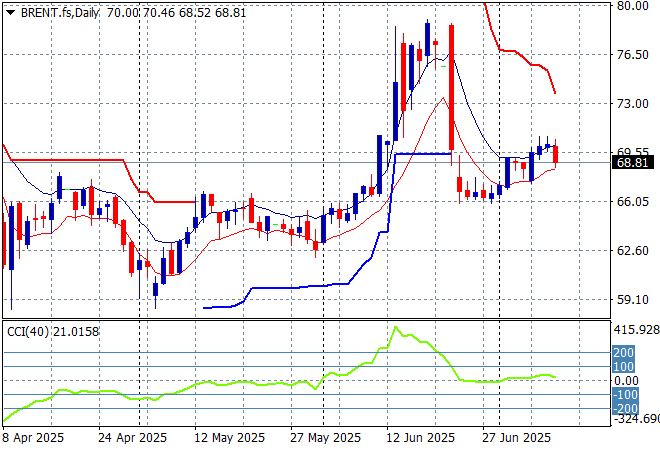
Oil markets were putting in a small bounce on the unexpected spike of OPEC+ production but failed to make substantive new daily highs as Brent crude retraced back below the $69USD per barrel level overnight.
The daily chart pattern shows the post New Year rally that got a little out of hand and now reverting back to the sideways lower action for the latter half of 2024. The potential for a return to the previous lows is building further if it cannot make a substantive new daily high.
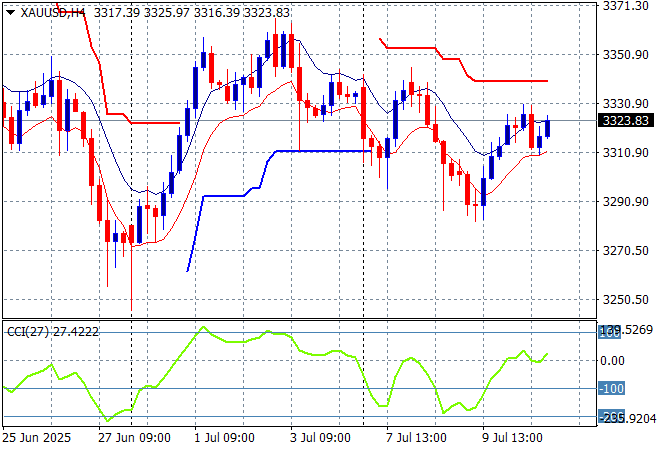
Gold is struggling again but managed to get out of its recent hole to bounce back above the $3300USD per ounce level overnight but signs of capitulation are building,
Short term support has been under threat most of the last three weeks with price almost returning to the late June lows as the USD gains strength. Momentum is not yet positive on the short or medium term timelines:
Glossary of Acronyms and Technical Analysis Terms:
ATR: Average True Range – measures the degree of price volatility averaged over a time period
ATR Support/Resistance: a ratcheting mechanism that follows price below/above a trend, that if breached shows above average volatility
CCI: Commodity Channel Index: a momentum reading that calculates current price away from the statistical mean or “typical” price to indicate overbought (far above the mean) or oversold (far below the mean)
Low/High Moving Average: rolling mean of prices in this case, the low and high for the day/hour which creates a band around the actual price movement
FOMC: Federal Open Market Committee, monthly meeting of Federal Reserve regarding monetary policy (setting interest rates)
DOE: US Department of Energy
Uncle Point: or stop loss point, a level at which you’ve clearly been wrong on your position, so cry uncle and get out/wrong on your position, so cry uncle and get out!