

Overnight saw the Federal Reserve hold fire in their latest FOMC meeting although the reasons were more domestic than foreign macro problems as the Trump regimes tariff tirades are really starting to slowdown the US economy. The potential entry of the US into the fraca in the Middle East gave risk markets further pause but surprisingly the USD, bond yields and shares were relatively stable. The USD was able to push Euro and Pound Sterling down somewhat while the Australian dollar was able to hold at the 65 cent level again.
Oil prices are also holding at their high position with Brent crude oscillating around the $76USD per barrel level while gold took another hit, losing $20 or more to finish at the $3380USD per ounce level.
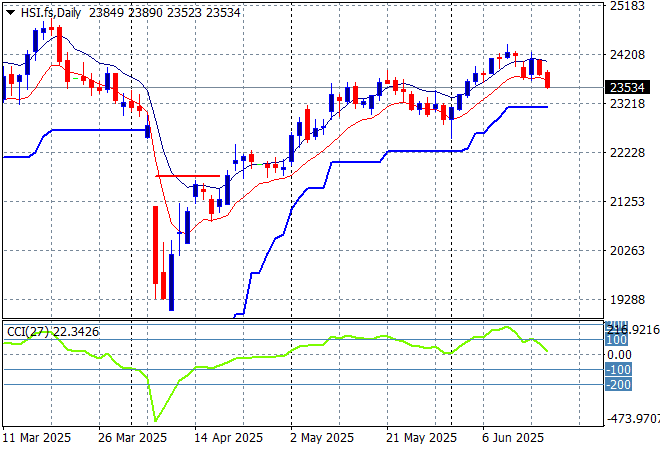
Looking at stock markets from Asia from yesterday’s session, where mainland Chinese share markets were somewhat steady going into the afternoon session as the Shanghai Composite remained slightly below the 3400 point level while the Hang Seng Index fell sharply, down over 1% as resistance builds at the 24000 point level.
The daily chart shows a near complete fill of the March/April selloff although momentum is now picking up again and remains slightly overbought as the 90 day “relief” continues without any further positive news. Watch for any crack below the low moving average or 23000 point level that could halt this breakout:
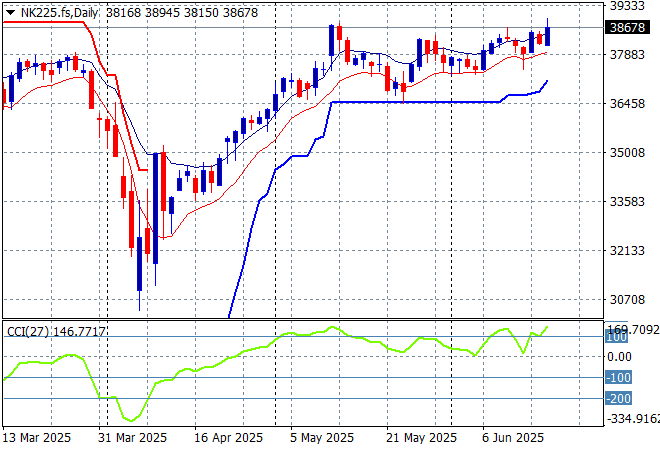
Japanese stock markets are pushing higher again with the Nikkei 225 moving up more than 0.7% to 38885 points.
Daily price action was looking very keen indeed although daily momentum has slowed down somewhat this week after clearing resistance at the 36000 point level with another equity market that looks stretched and ready to rollover again here. Watch ATR support closely which appears to be firming in recent sessions:
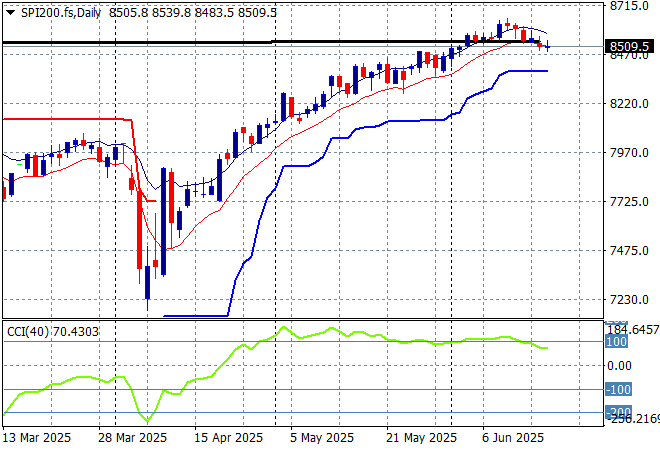
Australian stocks slipped again with the ASX200 closing 0.1% lower at 8531 points. SPI futures are down more than 0.2% given the uncertain session on Wall Street overnight.
The daily chart pattern is still suggesting further upside is still possible as the inverted head and shoulders pattern is nearly complete with the RBA cut helping boost this but correlation with other risk markets will come into play here – watch as daily momentum is now rolling over:
European markets can’t find any positive momentum with the Eurostoxx 50 Index losing nearly 0.5% 0vernight to close at 5266 points.
Support at the previous monthly support levels (black line) at 5100 points is now firmly held with the bounce off the 2024 lows at the 4400 point level indicating a massive fill of this dump and pump action with the former February highs nearly complete. A rollover is accelerating here so watch for support at the 5200 point level proper:

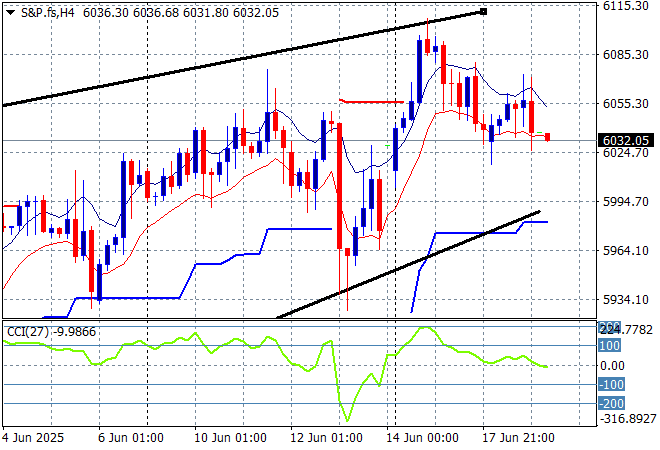
Wall Street had a very uncertain session given the potential for US involvement in the Iranian war and the FOMC meeting with the NASDAQ closing just 0.1% higher while the S&P500 eventually closed with a scratch session at 5980 points.
The four hourly chart was previously supporting a potential slowdown action here that could be translating to a top on the daily chart as prices fail to get back above the pre-Trump Tariff Tax day. A rollover is looming here so watch the 6000 point level to turn into resistance:
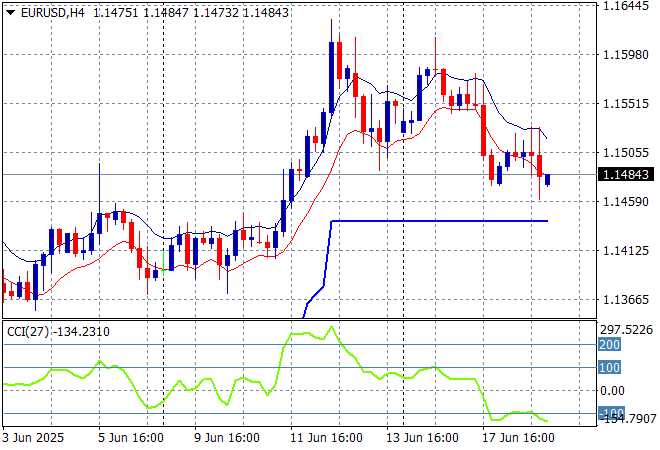
Currency markets want to return to an anti-USD mood but the uneasy language and position of the Fed at the latest FOMC meeting gave King Dollar a small reprieve overnight with gold and Euro pushed lower, the latter finishing below the 1.15 level to make a new weekly low.
The union currency had been building strength continuously as bad domestic economic news from the US overshadowed any continental slowdown. Medium term momentum was very overbought before the Israeli strike so this reversal is not unexpected. Watch for internal support in the short term at the 1.15 level:
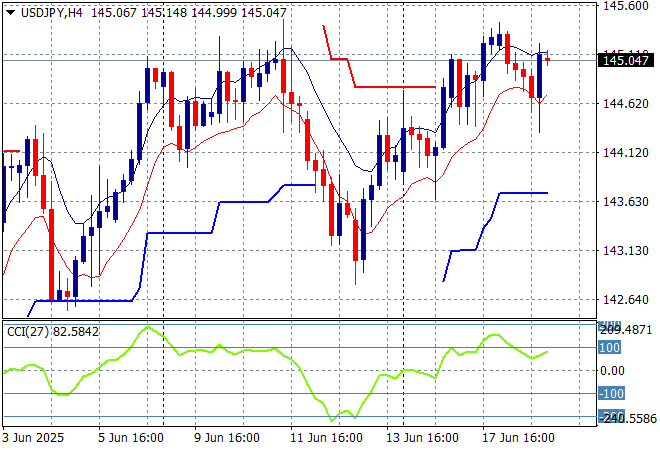
The USDJPY pair had a small reversal in yesterday’s session but is coming back somewhat on USD strength as it pipped through the 145 handle this morning.
I still contend we need to watch for any sustained break below the 139 level which completes a multi year bearish head and shoulders setup that could see the 110 to 120 level revisited. I’m still watching short term support that could come under pressure here again:
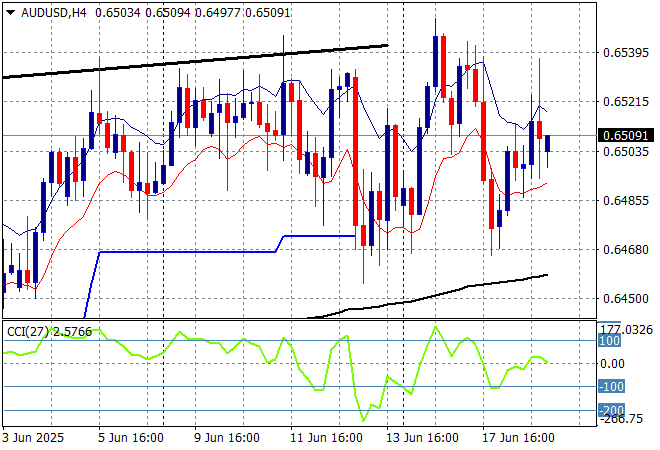
The Australian dollar continues to show a lot of internal support on the short and medium term charts as it holds around the 65 cent level despite the first mild pullback following the Middle East turmoil.
Stepping back for a longer point of view (and looking at the trusty AUDNZD weekly cross) price action has remained supported by the 200 day MA (moving black line) after bouncing off a near new five year low. Keep an eye on temporary support at the 63 cent level but this is still looking promising for the Pacific Peso:
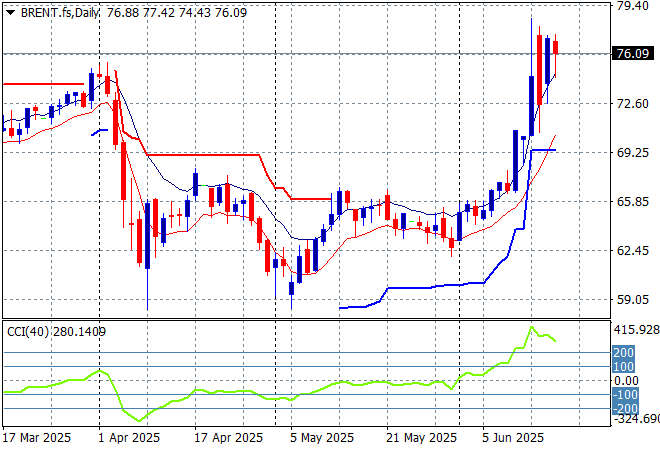
Oil markets are obviously highly volatile and will likely to continue to do so in coming sessions with Brent crude lifting again through the $76USD per barrel level overnight.
The daily chart pattern shows the post New Year rally that got a little out of hand and now reverting back to the sideways lower action for the latter half of 2024. The potential for a return to the previous lows is obviously off the table until the conflagration between Tel Aviv and Tehran subsides:
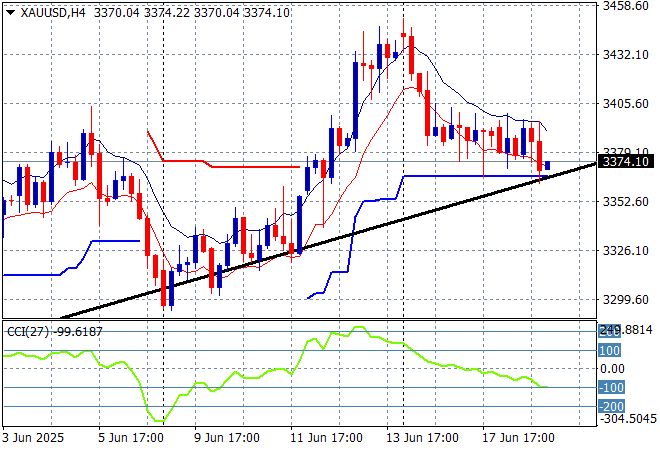
Gold was moving like the other undollars against USD after finding some stability last week but after recently managing to get over the $3400USD per ounce level it continues to deflate below that level and almost crossed its key uptrend line.
Short term support had firmed immensely in recent sessions showing real strength but momentum became considerably overbought so this was inevitable as price action has reverted back to the uptrend line from the April lows. However it seems to want to climb above the recent weekly/monthly highs and still have another crack at the $3400 level as USD weakens:
Glossary of Acronyms and Technical Analysis Terms:
ATR: Average True Range – measures the degree of price volatility averaged over a time period
ATR Support/Resistance: a ratcheting mechanism that follows price below/above a trend, that if breached shows above average volatility
CCI: Commodity Channel Index: a momentum reading that calculates current price away from the statistical mean or “typical” price to indicate overbought (far above the mean) or oversold (far below the mean)
Low/High Moving Average: rolling mean of prices in this case, the low and high for the day/hour which creates a band around the actual price movement
FOMC: Federal Open Market Committee, monthly meeting of Federal Reserve regarding monetary policy (setting interest rates)
DOE: US Department of Energy
Uncle Point: or stop loss point, a level at which you’ve clearly been wrong on your position, so cry uncle and get out/wrong on your position, so cry uncle and get out!