
Risk sentiment reversed its decline overnight mainly due to some off the cuff comments from the Trump regime’s Treasury Secretary about an “imminent” deal with China, which were since walked back but this sent a signal to buy USD and US stocks which saw Wall Street take back most of its recent session falls to rally well over 2% higher.
While currency and bond markets have been broadcasting fairly clearly now that the global trade and financial system is under enormous pressure, this one off reprieve may not last long as there is still the potential firing of Fed Chair Powell by King Trump but still we saw Euro pushed back below the 1.15 handle while the Australian dollar lost its recent foothold above the 64 level.
Oil prices are trying to build some support with Brent crude pushed back above the $66USD per barrel level while gold pulled back the sharpest after a huge surge over the weekend, to settle at the $3380USD per ounce level.
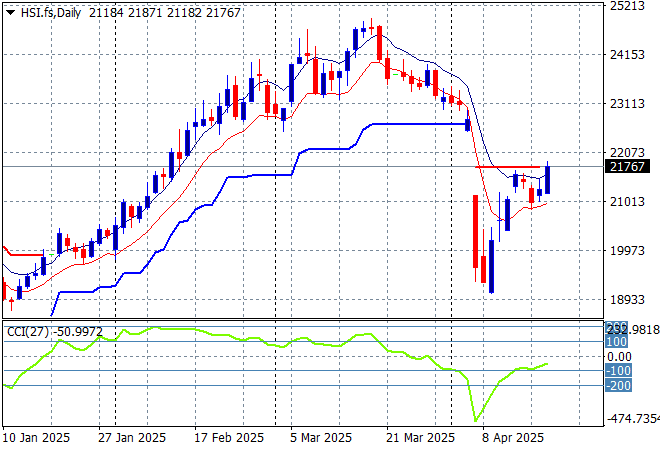
Looking at stock markets from Asia from yesterday’s session, where mainland Chinese share markets were able to move slightly higher with the Shanghai Composite almost above the 3300 point level while the Hang Seng Index reopened and lifted 0.8% to finish at 21562 points.
The Hang Seng Index daily chart shows a classic dead cat bounce setup following the collapse below the 20000 point level, with the rollover not yet in place despite the trade war with the US. This looks like a potential rally if traders can believe the headlines:
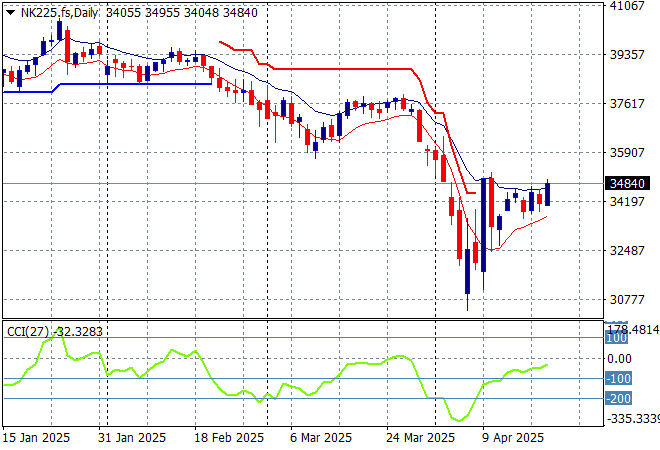
Japanese stock markets continued to slip yesterday with the Nikkei 225 down over 0.2% to 34227 points.
Price action is also displaying a classic dead cat bounce pattern with daily momentum unable to get back into positive readings nor push through former support, now resistance at the 36000 point level. Futures are indicating a lift on the open this morning:
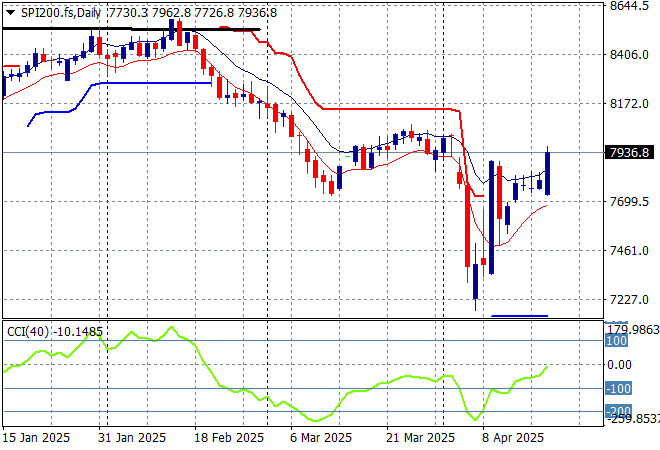
Australian stocks reopened from the Easter long weekend with the ASX200 closing nearly dead flat just above the 7800 point level.
However SPI futures are indicating at least a 1% rise on the open although this maybe walked back given the shaky foundation for the rally on Wall Street.
The daily chart pattern suggests further downside is inevitable as the Chinese counter-counter tariffs take effect but watch for a potential short covering rally back to 8000 points or so first, but it seems the writing is on the wall:
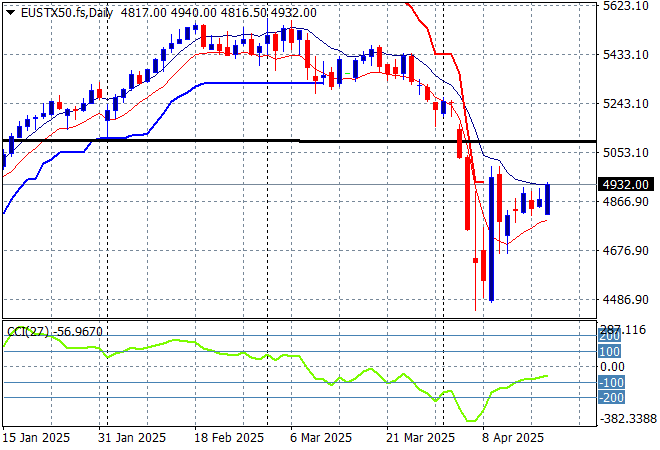
European markets also reopened from the long weekend with Eurostoxx 50 Index closing some 0.5% higher at 4961 points.
Support at the previous monthly support levels (black line) at 5100 points failed to hold so 2024 lows at the 4400 point level are still in sight, with yet another dead cat bounce which seems to be forming here:
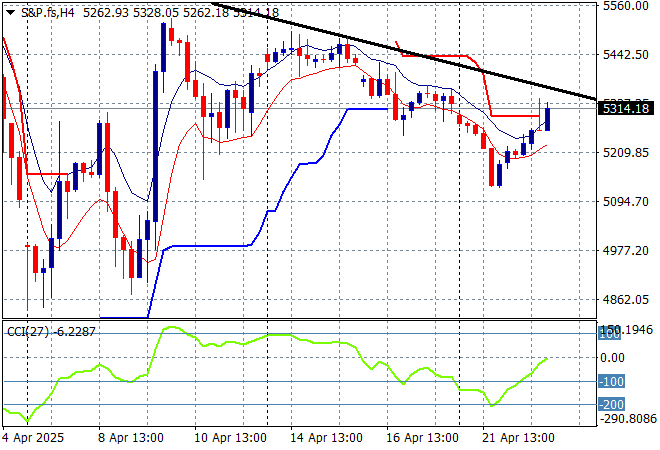
Wall Street was showing the way as its dead cat with a roll over with tech earnings in the spotlight but still the NASDAQ and the S&P500 were both pushed nearly 2.5% higher with the latter eventually closing at the 5287 point level.
This is not looking good as the short term and medium term charts are pointing to a resumption of selling back below the 5000 point psychological barrier as the tariff impacts start to make themselves felt in earnings:
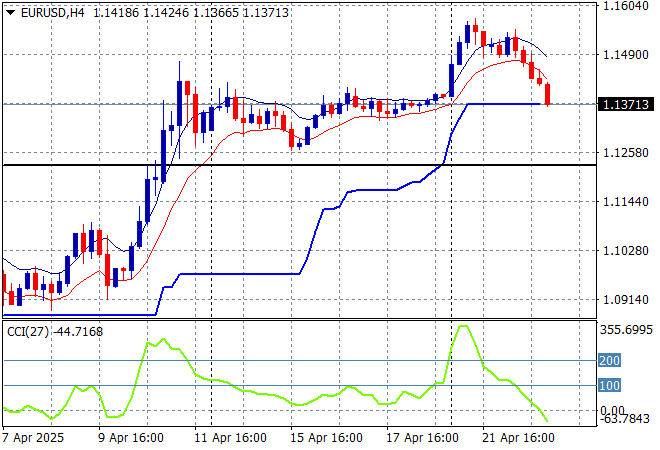
Currency markets are trying to understand fact from fiction when it comes to the fate of Fed Chair Powell and that of the USD amid talk and friction around trade deals from the Trump regime. Overnight saw a return to strength to the US Dollar after several weeks of weakness with Euro pulled back to below the 1.14 handle after being considerably overbought in recent sessions.
The union currency spiked up through the 1.13 handle last week, before pushing through a big volatile spike above the 1.15 handle over the Easter break before this pullback. The longer term trend still seems to be undollar across the board:
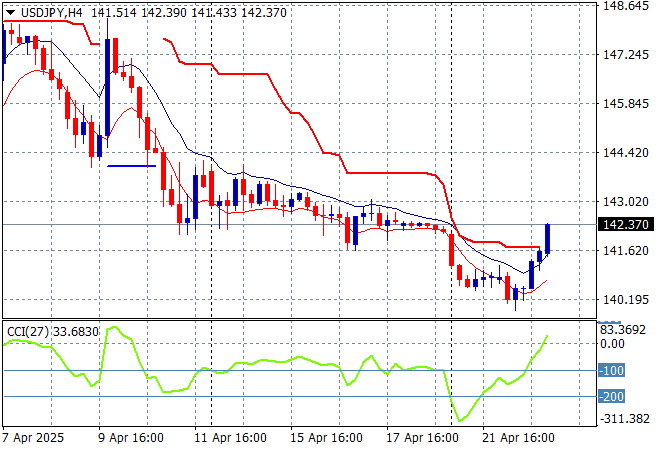
The USDJPY pair had recently failed to hold at its recent lows after settling at the 143 level but found itself overextended with a launch from the 140 handle overnight that extended into the low 142s but that only takes it back to last weeks lows.
Short term momentum was extremely oversold but without any sign of a potential swing play building as it seemed Yen could only go higher as the USD is dumped amid a new trade bloc forming in the Asia-Pacific with the US. Watch for any sustained break below the 139 level next which completes a multi year bearish head and shoulders setup that could see the 110 to 120 level revisited but in the short term the high volatility around USD could see a rally back up to the mid 144 level:
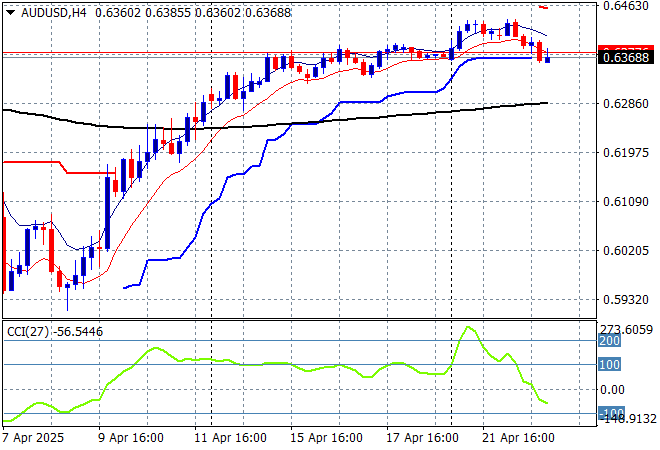
The Australian dollar was slowly extending its gains with a mild move above the 64 cent level to extend above the pre-tariff announcement levels, although short term momentum was showing a slowdown here before rolling over last night to just above the mid 63 cent level.
Stepping back for a longer point of view (and looking at the trusty AUDNZD weekly cross) price action has crossed back above the 200 day MA (moving black line) after bouncing off a near new five year low. This is all about the USD, not the Australian economy so I’m wary here but you’ve got to follow price, keeping an eye on temporary support at the 63 cent level:
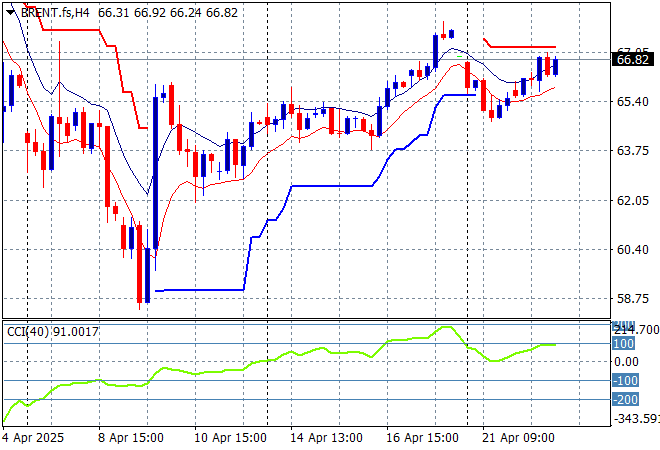
Oil markets are trying hard to hold onto its post tariff pause bounce with Brent crude lifting back above the $66USD per barrel level following a brief pullback over the weekend gap.
The daily chart pattern shows the post New Year rally that got a little out of hand and now reverting back to the sideways lower action for the latter half of 2024. The potential for a return to the 2024 lows is still building here as domestic demand in the US is likely to collapse despite the very short term change in sentiment:
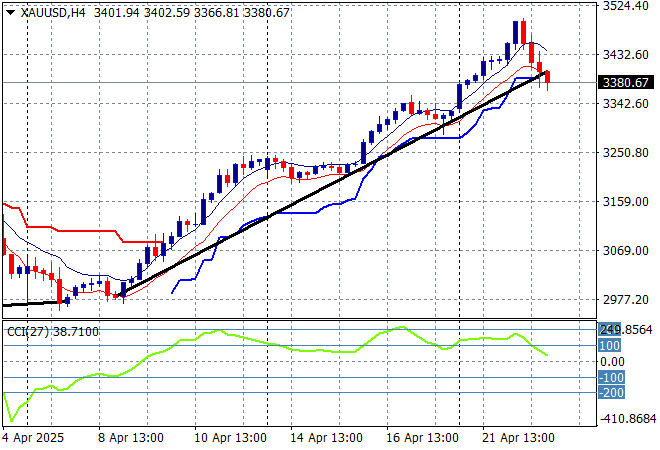
Gold pulled back overnight after sharply moving higher in recent weeks as it got way ahead of itself at least on the short term charts finishing at the $33800USD per ounce level as of this morning.
Short term support had firmed immensely in recent sessions showing real strength but momentum became considerably overbought so this was inevitable as price action has reverted back to the uptrend line from the April lows. There is further support at the $3200 level that could be tested next on the overshoot:
Glossary of Acronyms and Technical Analysis Terms:
ATR: Average True Range – measures the degree of price volatility averaged over a time period
ATR Support/Resistance: a ratcheting mechanism that follows price below/above a trend, that if breached shows above average volatility
CCI: Commodity Channel Index: a momentum reading that calculates current price away from the statistical mean or “typical” price to indicate overbought (far above the mean) or oversold (far below the mean)
Low/High Moving Average: rolling mean of prices in this case, the low and high for the day/hour which creates a band around the actual price movement
FOMC: Federal Open Market Committee, monthly meeting of Federal Reserve regarding monetary policy (setting interest rates)
DOE: US Department of Energy
Uncle Point: or stop loss point, a level at which you’ve clearly been wrong on your position, so cry uncle and get out/wrong on your position, so cry uncle and get out!