
Risk sentiment is slowly lifting and stock volatility moving lower but all eyes must remain on global bond markets and the USD as the big shift is happening beyond the equity market headlines. The short covering rally on Wall Street could continue for a little longer but USD is still slowly losing its reserve currency status as Euro, Swiss Franc, Pound Sterling – almost everything continues to be bid higher. The Australian dollar is now above the 63 handle but could have some volatility as we look through today’s release of the RBA minutes.
Treasuries remain the key market to watch with 10 year yields about to push through the 4.5% level for a near 50bps change since last week with 30 year yields now threatening the 5% level. Oil prices are trying to recover but Brent crude is struggling to get back above the $65USD per barrel level. Gold is slowly down after making new highs after its recent surge above the $3200USD per ounce level, with a very mild pullback and pause overnight.
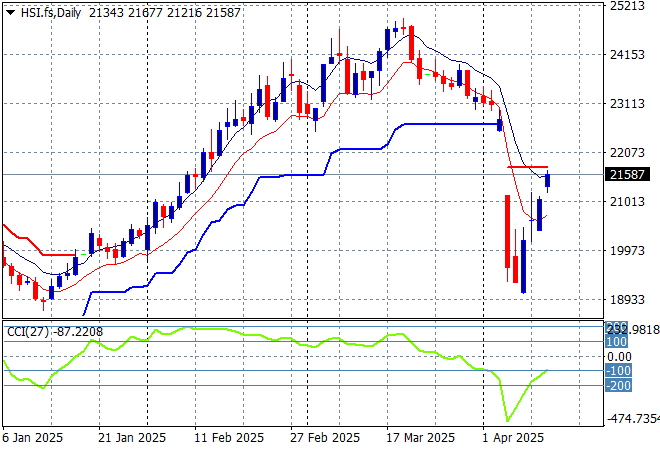
Looking at stock markets from Asia from yesterday’s session, where mainland Chinese share markets were able to push higher in afternoon trade despite the major trade war with the US with the Shanghai Composite up 0.7% to extend above the 3200 point level while the Hang Seng Index lifted 2% higher to 21336 points.
The Hang Seng Index daily chart shows how this recent move looked unsustainable to the upside after recently setting up for another potential breakdown around the 20000 point level. Momentum has reversed completely to panic selling with support at the 22000 point level completely wiped out. More to come or is everything awesome:
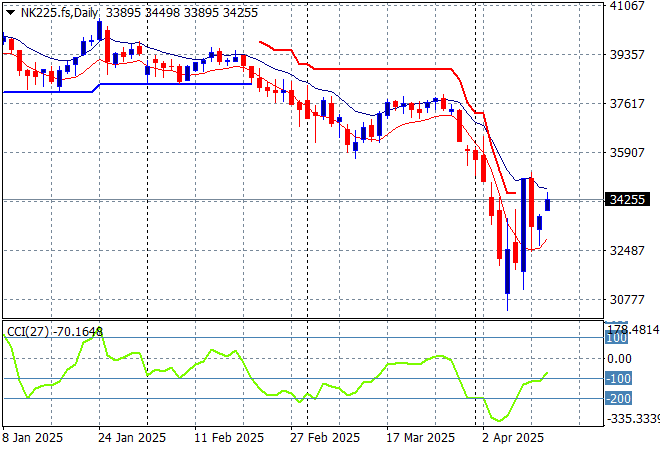
Japanese stock markets are also playing catchup after a poor showing last week with the Nikkei 225 up nearly 1.2% to 33982 points.
Price action had been indicating a rounding top on the daily chart for sometime now with daily momentum retracing away from overbought readings with the breakout last month above the 40000 point level now in full remission. Yen volatility alongside correlation with other risk markets are the main problem here, although futures are indicating another small bounce on the open this morning:
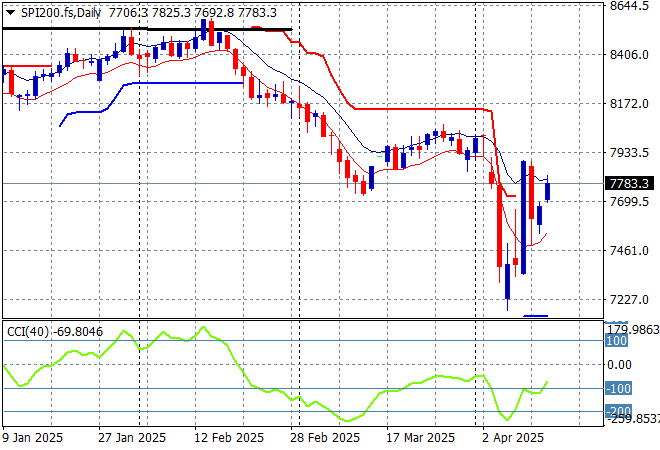
Australian stocks managed a very solid session with the ASX200 up 1.3% at 7746 points.
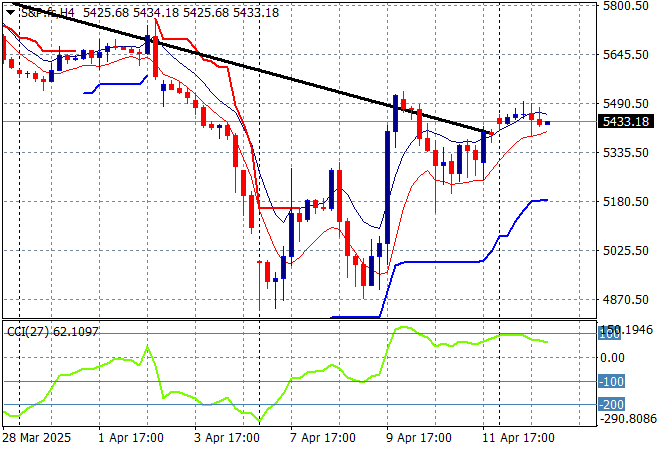
SPI futures are up only 0.2% despite the rally Wall Street from overnight as caution reigns. The daily chart pattern suggests further downside is inevitable as the Chinese counter-counter tariffs take effect but watch for a potential short covering rally back to 8000 points or so first:
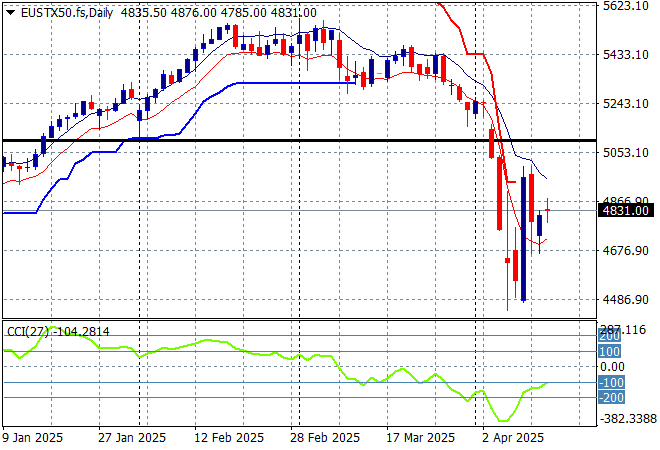
European markets were able to lift strongly overnight with strong moves across the continent with the Eurostoxx 50 Index finishing more than 2% higher at 4911 points.
Support at the previous monthly support levels (black line) at 5100 points failed to hold so 2024 lows at the 4400 point level are now in sight, baring a dead cat bounce which seems to be forming here. Still a good time for more European defence stock purchases (almost):
Wall Street reduced in volatility with only mild gains as the tariff confusion over Chinese tech continued with the NASDAQ gaining just 0.6% while the S&P500 pushed nearly 0.8% higher to eventually close at the 5405 point level.
The Trump pump and dump scheme moved out of its first dead cat bounce phase and into the “pump that cat full of steroids and see if it revives” stage, and right now that cat is laying down for a nap. I still contend we are going lower but 90 days is a LONG time:
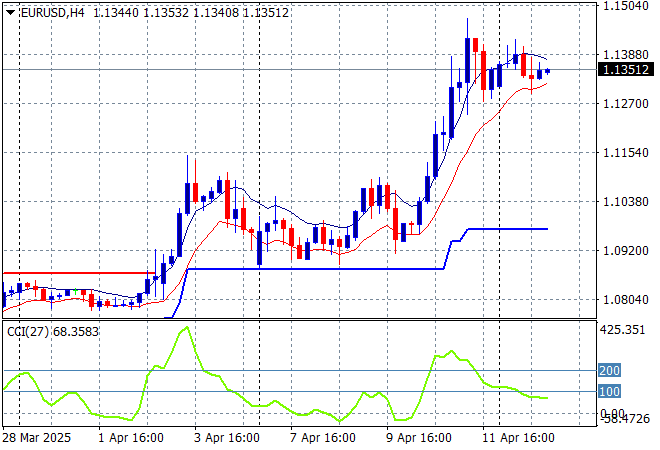
Currency markets are still wanting to push the US Dollar down but the first session after the weekend gap saw more consolidation amongst the undollars with Euro holding at the mid 1.13 handle overnight but looks set to zoom past the 1.15 handle next.
The union currency spiked up through the 1.11 handle mid week before retracing in the previous session but is finding straight support at that level now to springboard higher although it is considerably overbought and has to navigate quite a few releases coming up this week:
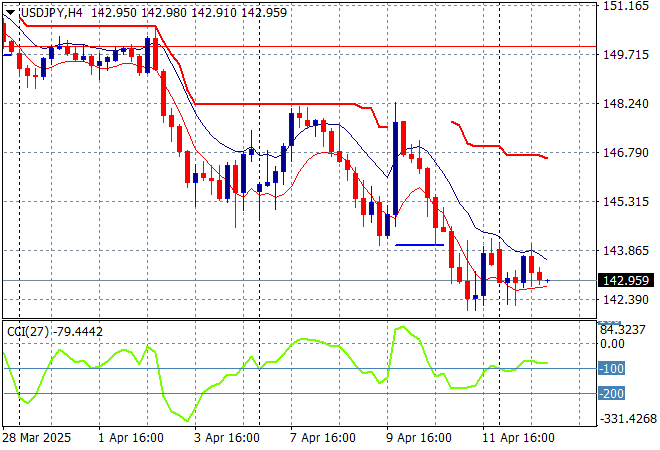
The USDJPY pair is holding at its recent lows, settling below the 143 level without much upside potential building here.
Short term momentum was extremely oversold and showed a potential swing play here but that has disappeared as Yen can only go higher as the USD is dumped amid a new trade bloc forming in the Asia-Pacific with the US:
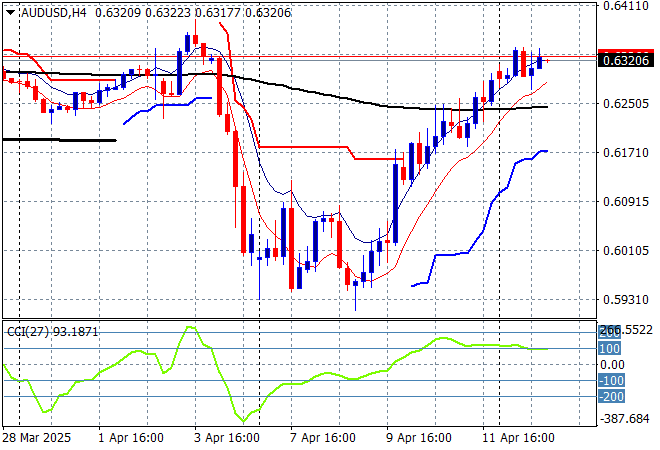
The Australian dollar continues to extend its gains with a slight move above the 63 cent level to now get back to the pre-tariff announcement levels.
Stepping back for a longer point of view (and looking at the trusty AUDNZD weekly cross) price action is still solidly below the 200 day MA (moving black line) and near new five year low. This is not yet over but watch for an attempt to hold here at the 63 cent level in the short term first:
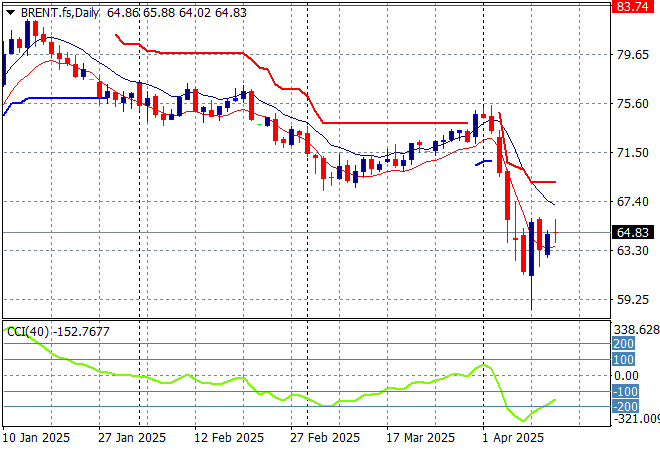
Oil markets are trying hard to hold onto its post tariff pause bounce with Brent crude remaining below the $65USD per barrel level after the weekend gap.
The daily chart pattern shows the post New Year rally that got a little out of hand and now reverting back to the sideways lower action for the latter half of 2024. The potential for a return to the 2024 lows was building here before this short term bounce and is now baked in and then some as demand will collapse despite the very short term change in sentiment:
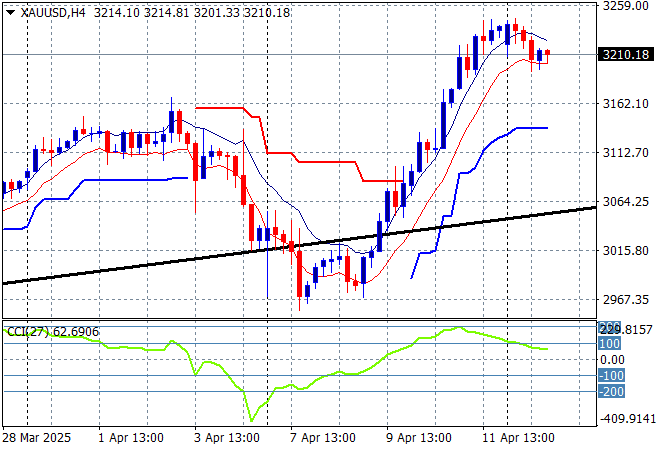
Gold zoomed up above the $3200USD per ounce level last week but saw a mild pullback overnight to hold at $3210 this morning.
Short term support has firmed immensely in recent sessions showing some real strength here and while momentum is considerably overbought we could see even more upside here with the $3200 area likely to hold here with a small dip on profit taking:
Glossary of Acronyms and Technical Analysis Terms:
ATR: Average True Range – measures the degree of price volatility averaged over a time period
ATR Support/Resistance: a ratcheting mechanism that follows price below/above a trend, that if breached shows above average volatility
CCI: Commodity Channel Index: a momentum reading that calculates current price away from the statistical mean or “typical” price to indicate overbought (far above the mean) or oversold (far below the mean)
Low/High Moving Average: rolling mean of prices in this case, the low and high for the day/hour which creates a band around the actual price movement
FOMC: Federal Open Market Committee, monthly meeting of Federal Reserve regarding monetary policy (setting interest rates)
DOE: US Department of Energy
Uncle Point: or stop loss point, a level at which you’ve clearly been wrong on your position, so cry uncle and get out/wrong on your position, so cry uncle and get out!