
More tariff fallouts overnight as the April 2 deadline looms with Trump whining about Canadian-EU collaboration in the latest round of threats, while stocks put in slight selloffs amid the low volatility reactions. The USD pulled back ever so slightly against Euro and Pound Sterling but remains firm against Yen while the Australian dollar was unphased as it hangs around the 63 cent level.
10 year Treasury yields lifted again as the selloff in US bonds accelerates to beyond the 4.36% level while oil prices moved higher on their recent gains with Brent crude pushing further above the $73USD per barrel level. Gold however was the standout as it made a new record high after holding above the magical $3000USD per ounce level all week, hitting the $3050 level overnight.
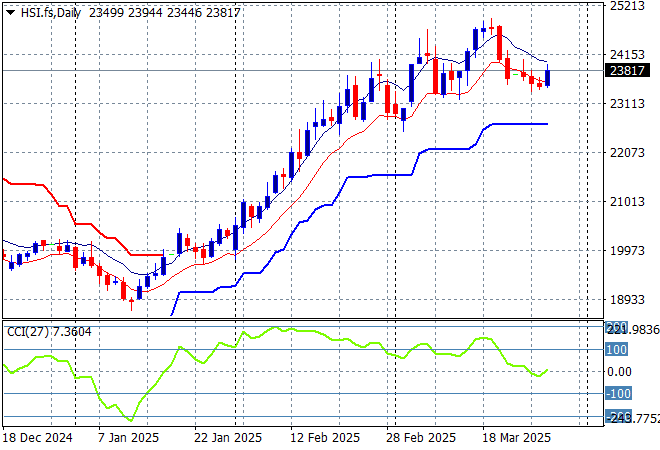
Looking at stock markets from Asia from yesterday’s session, where mainland Chinese share markets only lifted slightly in afternoon trade with the Shanghai Composite barely up 0.2% while the Hang Seng Index moved higher, closing up 0.4% to 23578 points.
The Hang Seng Index daily chart shows how this recent move looked unsustainable to the upside after recently setting up for another potential breakdown around the 20000 point level. Momentum has retraced from being well overbought after beating the previous monthly highs at the 21500 level but is not yet negative:
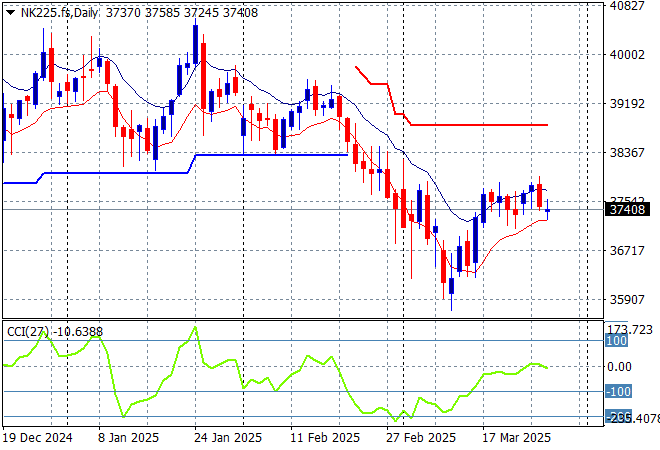
Japanese stock markets however reversed their recent gains with the Nikkei 225 down over 0.6% to close at 37799 points.
Price action had been indicating a rounding top on the daily chart for sometime now with daily momentum retracing away from overbought readings with the breakout last month above the 40000 point level now in full remission. Yen volatility remains a problem here, with a sustained return above the 38000 point level still unlikely although futures are indicating a small drop on the open:
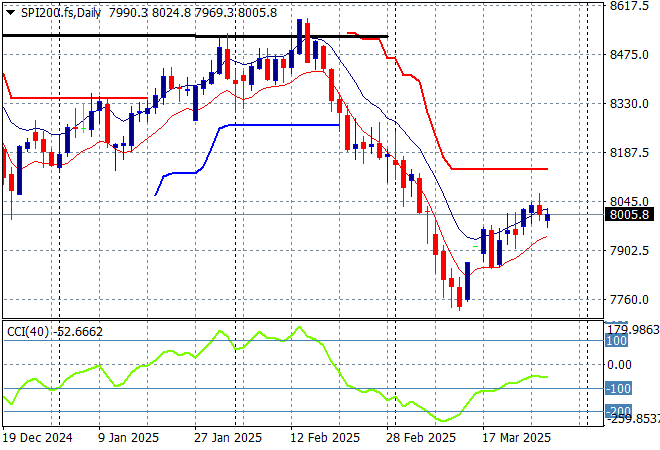
Australian stocks are failing to make headway with the ASX200 closing more than 0.3% lower to stay well below the 8000 point level, finishing at 7969 points.
SPI futures are down just 0.1% despite slightly deeper falls on Wall Street overnight. The daily chart pattern suggests entrenched resistance overhead at the 8500 point level is far too heavy for the market to overcome with short term momentum somewhat oversold but price action is still indicating a minor bounce here:
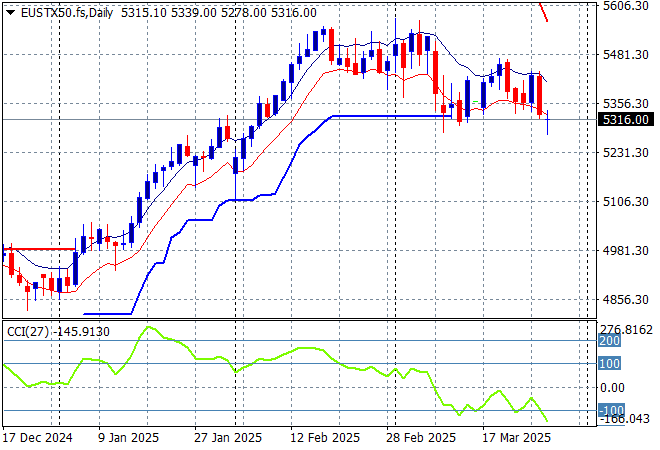
European markets continue to give up their previous gains with minor falls across the continent with the Eurostoxx 50 Index finishing 0.5% lower at 5381 points.
This was setting up for a breakdown with short term support taken out and the ATR support from the recent uptrend now under threat as momentum went into oversold mode but I still contend looks like another launching pad to buy more European defense stocks as they decouple from Wall Street – but watch for a potential overshoot here:
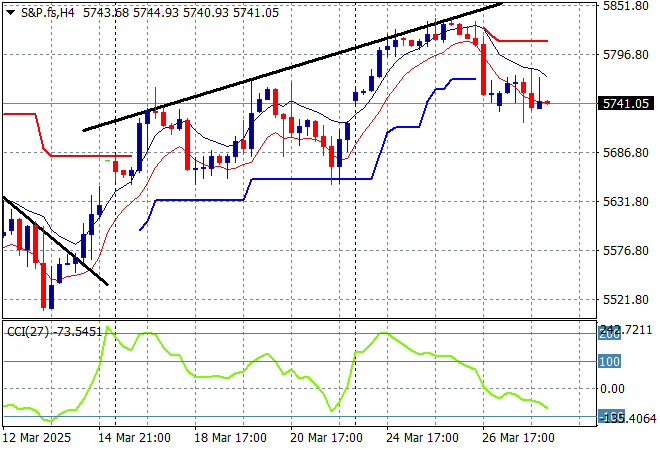
Wall Street also couldn’t follow through on its start of week surge with the NASDAQ falling more than 0.5% while the S&P500 lost just over 0.3% to close at 5693 points.
The Trump pump and dump scheme is back in business as the April 2 tariffs come on line soon, with another reversal in the works here:
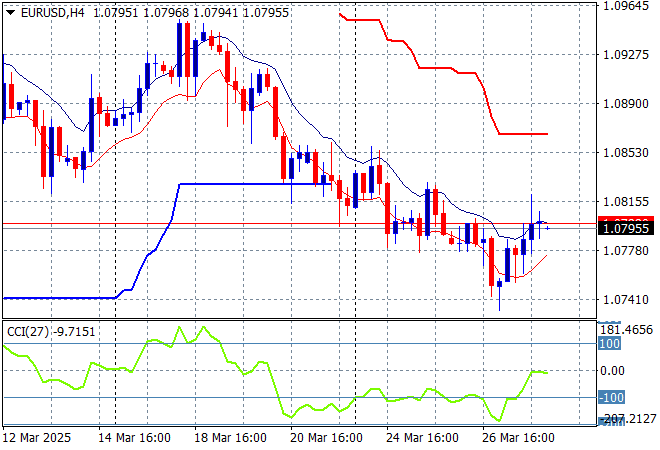
Currency markets are wavering in their anti King Dollar mood amid the growing trade wars with most undollars pushing back against USD with the latest US initial jobless claims or record US trade deficit not spoiling the broth too much. Euro is failing to get back on trend but managed a small bounce overnight to almost get back above the 1.08 level after recently breaking weekly support.
The union currency is barely holding on despite the tariff trade war with short and medium term support building at higher levels. Momentum was overextended earlier in the week and has now flipped to oversold setting so watch for the 1.08 handle to turn into resistance here:
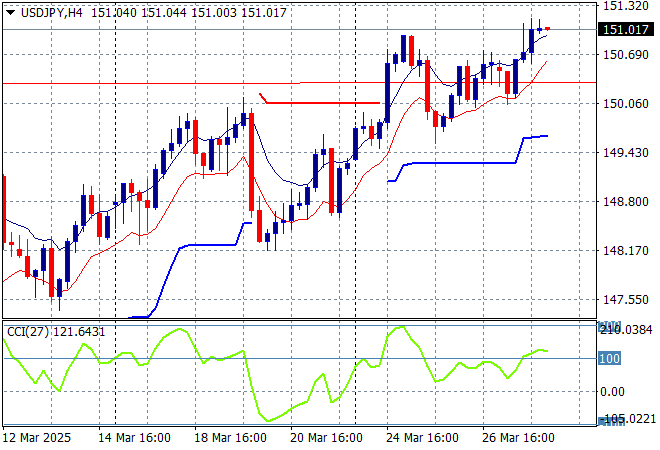
The USDJPY pair is doing well to remain on trend however with a new high overnight as it managed to not only clawback its mid week losses but extended well above the 151 level as USD gains strength.
Short term momentum was extremely oversold before the start of week bounce but required price action to at least get over the 156 level to call this a proper trend higher. USD is not weakening as expected here so we could see a more sustained run higher as Yen takes a back seat:
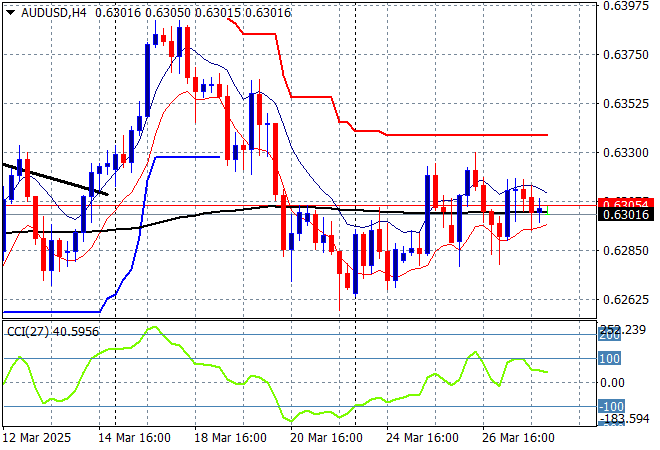
The Australian dollar is really trying to get back into the swing of things but was thwarted again after a false break above the 63 cent level in the previous session with almost no moves overnight.
The recent follow through to the high 62’s and low 63’s was always high risk going into the live February RBA rate meeting and after the Trumpian tariff crusade although price action has now breached the 200 day MA (moving black line) which could turn into resistance:
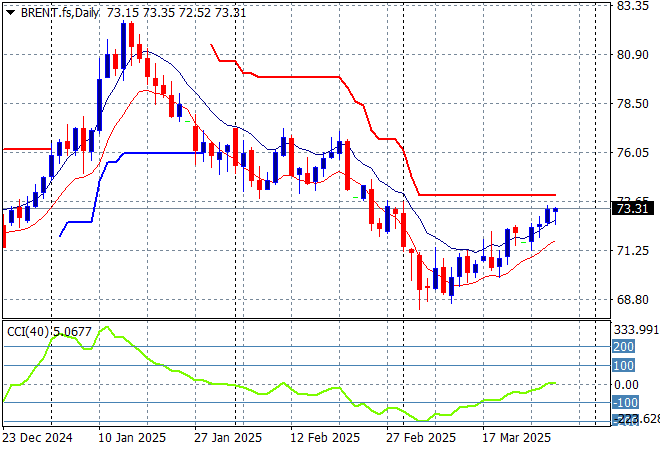
Oil markets are also trying to hard sell a new uptrend but this is looking a lot better now as Brent crude finally makes headway above the $72USD per barrel level extending into the $73 zone to convert this small bounce off the recent monthly lows.
The daily chart pattern shows the post New Year rally that got a little out of hand and now reverting back to the sideways lower action for the latter half of 2024. The potential for a return to the 2024 lows is building here, although there is some more buying support slowly building:
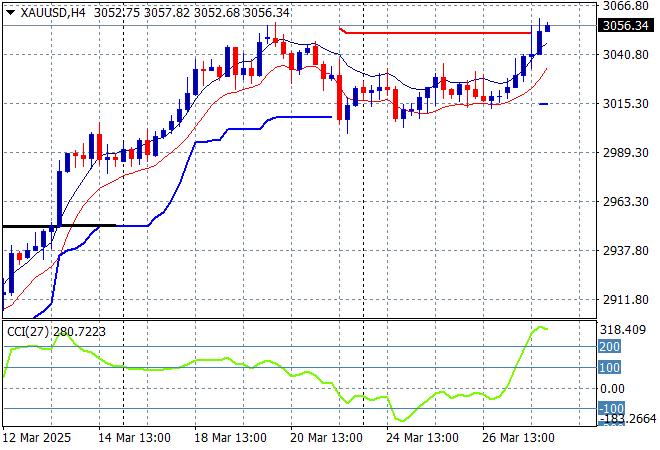
Gold had a small hiccup on Friday night but has now turned this into a new record high as it held well above the $3000USD per ounce level all week, exceeding the $3050 level overnight.
Price action has always found a lot of resistance just under the $2960 zone so that was the likely target in any upside potential but that has been deftly pushed aside without any substantial pullback thereafter, finding a very solid bid up here at new historic highs. Watch for support to hold at the $3000 level:
Glossary of Acronyms and Technical Analysis Terms:
ATR: Average True Range – measures the degree of price volatility averaged over a time period
ATR Support/Resistance: a ratcheting mechanism that follows price below/above a trend, that if breached shows above average volatility
CCI: Commodity Channel Index: a momentum reading that calculates current price away from the statistical mean or “typical” price to indicate overbought (far above the mean) or oversold (far below the mean)
Low/High Moving Average: rolling mean of prices in this case, the low and high for the day/hour which creates a band around the actual price movement
FOMC: Federal Open Market Committee, monthly meeting of Federal Reserve regarding monetary policy (setting interest rates)
DOE: US Department of Energy
Uncle Point: or stop loss point, a level at which you’ve clearly been wrong on your position, so cry uncle and get out/wrong on your position, so cry uncle and get out!